Review
. 2008 Oct 7;53(19):R319-50.
doi: 10.1088/0031-9155/53/19/R01. Epub 2008 Aug 29.

In vivo small-animal imaging using micro-CT and digital subtraction angiography

Affiliations
Review

In vivo small-animal imaging using micro-CT and digital subtraction angiography

C T Badea et al. Phys Med Biol. .

Abstract

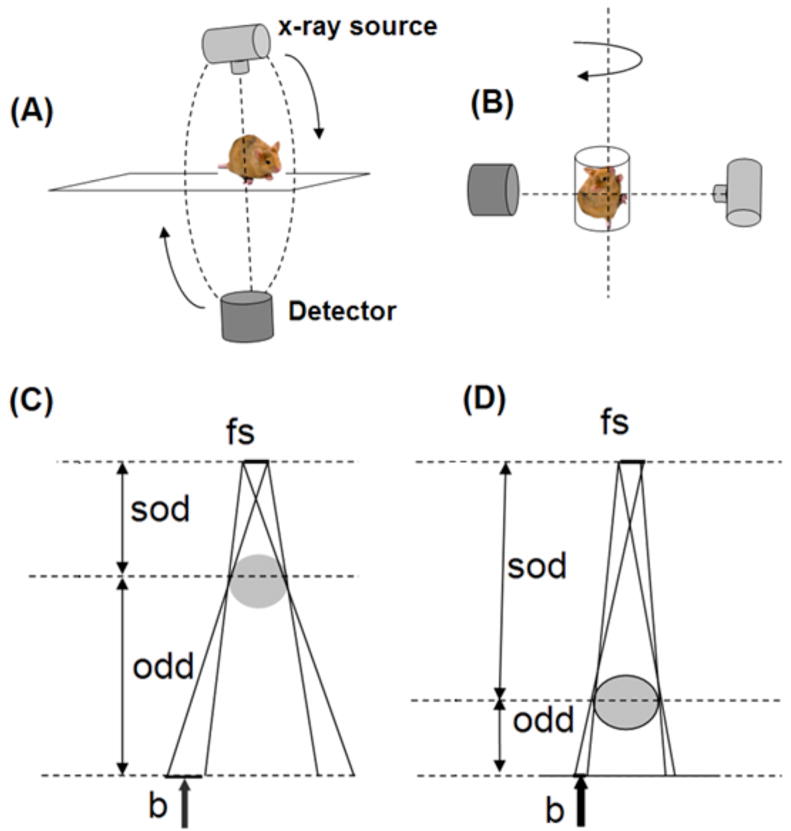
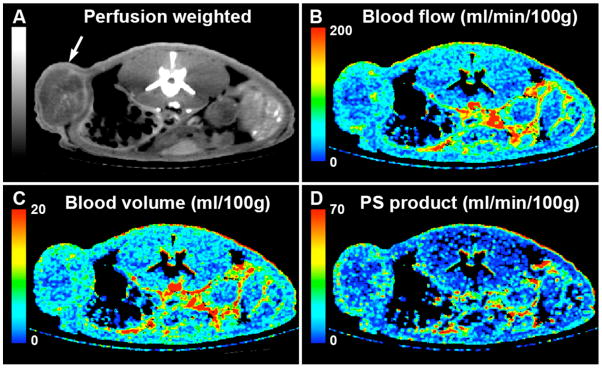
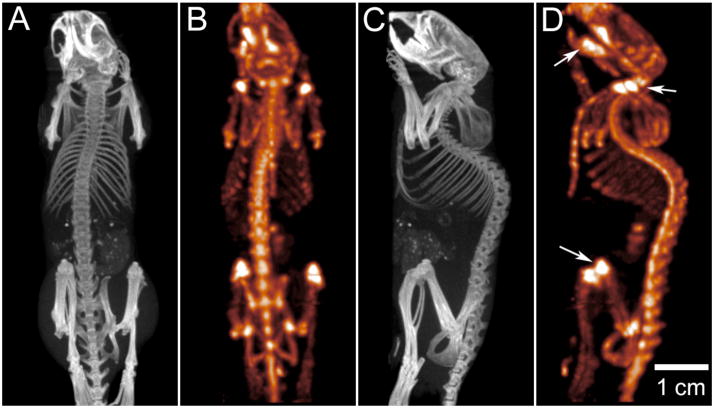
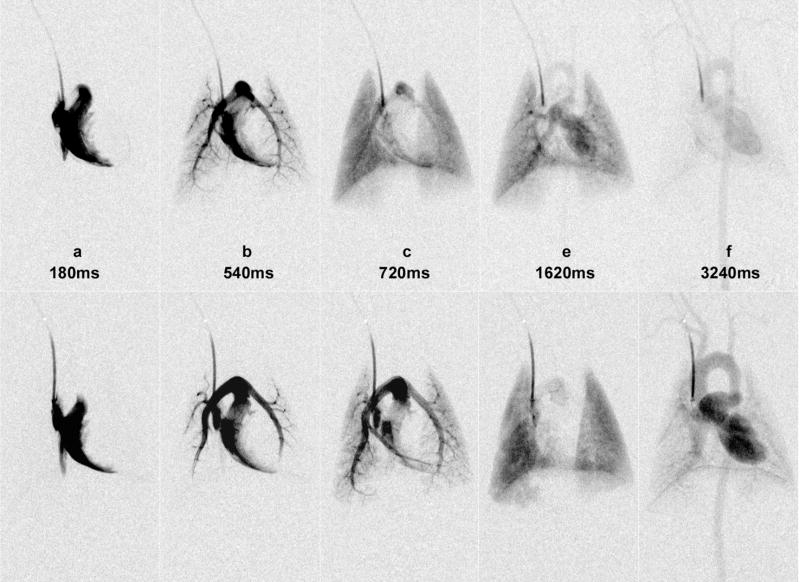
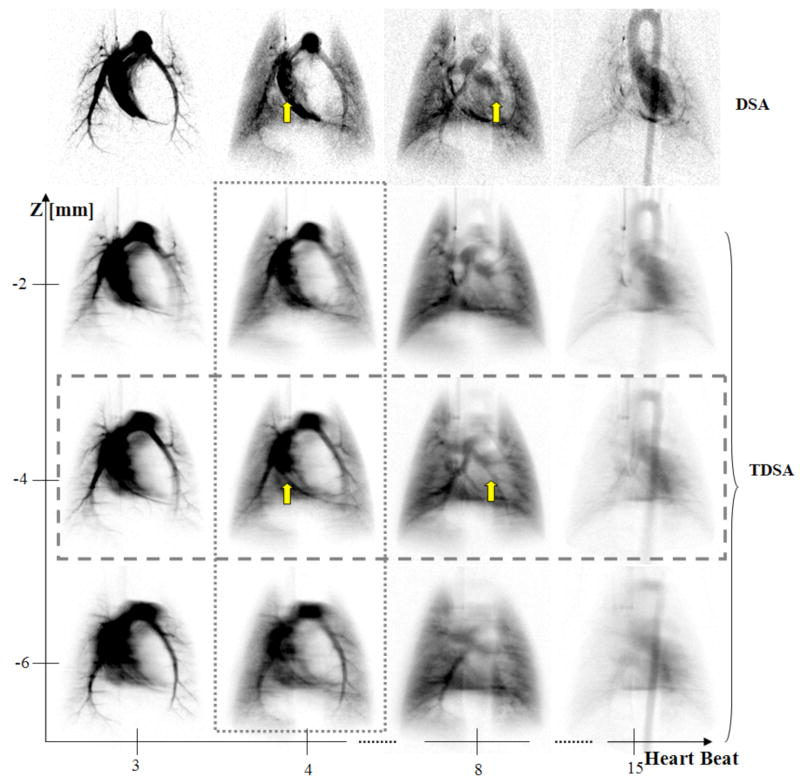
Small-animal imaging has a critical role in phenotyping, drug discovery and in providing a basic understanding of mechanisms of disease. Translating imaging methods from humans to small animals is not an easy task. The purpose of this work is to review in vivo x-ray based small-animal imaging, with a focus on in vivo micro-computed tomography (micro-CT) and digital subtraction angiography (DSA). We present the principles, technologies, image quality parameters and types of applications. We show that both methods can be used not only to provide morphological, but also functional information, such as cardiac function estimation or perfusion. Compared to other modalities, x-ray based imaging is usually regarded as being able to provide higher throughput at lower cost and adequate resolution. The limitations are usually associated with the relatively poor contrast mechanisms and potential radiation damage due to ionizing radiation, although the use of contrast agents and careful design of studies can address these limitations. We hope that the information will effectively address how x-ray based imaging can be exploited for successful in vivo preclinical imaging.


Figures

Figure 1
Figure 1
The two possible design geometries for micro-CT are based on rotating gantry (A) or rotating specimen (B). The effect of penumbra blurring: for the same focal spot size (fs) of the x-ray source the penumbra blurring b is larger when the object is closer to the source (C) than when the object is closer to the detector (D). sod and odd refer to the source-object-distance and object-detector-distance.
Figure 2
Figure 2
Axial, oblique and coronal micro-CT images of the same C57BL/6 mouse scanned in vivo with 88 μm voxel size without (A,D,G) and with (B,E,H) cardio-respiratory gating using a a liposomal blood pool contrast agent. The images (C,F,I) were acquired ex-vivo. The arrows indicate how the heart wall and the papillary muscles are affected by motion when no gating was used (A,D), while becoming sharp with gating (B,E). The oval region of interest (ROI) shows how the diaphragm is blurred due to respiration motion (G) in comparison with the gated acquisition (H) or the ex-vivo scanning (I). Similarly, the circle ROIs focus on the lung parenchyma and display the clear advantage of gating (E) versus not gating the acquisition (D).
Figure 3
Figure 3
Example of the effect of reduced spatial resolution in ex vivo micro-CT imaging of rodent bones. In this case, an excised rat femur has been imaged for 3.5 hours (80 kVp, 740 mAs, 720 views), with nominal spatial resolution of 16 μm (A,C) and 48 μm (B,D). The magnified images (C,D) illustrate some loss in ability to discriminate small structures in the femoral head with reduced resolution.
Figure 4
Figure 4
Longitudinal in vivo imaging of the progression of osteoarthritis (OA) in a rat model. The acquisition protocol (80 kVp, 190 mAs, 210 views) was designed to provide an appropriate entrance exposure (36 cGy) for repeated imaging. The same limb has been imaged before surgery (a,c) and two months following surgery (anterior cruciate ligament transection and partial meniscectomy) to induce OA (b,d). Post-surgery images demonstrate significant reduction in joint space (JS) in the medial compartment, remodeling of subchondral bone (SB), and pathological calcification of the patellar tendon (PT). 3D surface models of the joint (a,b) demonstrate the striking derangement of the joint over a period of 2 months; note the change in alignment of the femur (F) and tibia (T). Images courtesy of David McErlain, Robarts Research Institute, University of Western Ontario.
Figure 5
Figure 5
Example data from in vivo xenon-enhanced contrast imaging of the rat lung. Breath-hold 3D CT image acquisition (8s scans with 0.152 mm isotropic spacing) provides both multi-planar reformatted (A) and minimum intensity projection (B) images of the air-filled lung, as well as images derived from subtraction of xenon-filled and air-filled lung images, illustrated by the maximum intensity projection in (C). Isotropic spatial resolution, combined with rapid breath-hold scanning facilitates automated segmentation of the lung and airway boundaries (D). Images courtesy of Dr. Giles Santyr, Robarts Research Institute, University of Western Ontario.
Figure 6
Figure 6
(A) Micro-CT images in the coronal orientation during 12 time points in the cardiac cycle (temporal resolution 10 ms). The spatial resolution is 0.1 mm and isotropic. (B) The 4D data is visualized and can be analyzed with semi-automatic tools (Badea et al., 2008b) to segment and measure the volume of blood in the left ventricle, based on which the cardiac function measures such as ejection fraction, stroke volume and cardiac output can be computed.
Figure 7
Figure 7
Retrospectively gated cardiac micro-CT applied to the study of ventricular remodeling post myocardial infarction in C57Bl6 mice. Coronal long axis (top) and short-axis (bottom) images are shown of a mouse heart prior to (A) and 4 weeks following (B) myocardial infarction induced by ligation of the left anterior descending coronary artery. The arrows indicate the infarcted region near the apex of the left ventricle. 4D images were acquired in 50 seconds with isotropic voxel spacing of 150 μm and using a low-dose injection of Fenestra VC. Images courtesy of Sarah Detombe, Robarts Research Institute, University of Western Ontario.
Figure 8
Figure 8
A) Liver enhancement 8 hours following the intravenous injection of Fenestra VC enables the clear distinction of liver metastases (black arrows in A) from liver tissue and blood vessels. The addition of intraperitoneal administration of iohexol greatly enhances the delineation of liver tumor borders when the tumors have grown on the surface of the liver (white arrow). The image in (A) is a coronal section from a retrospectively respiratory-gated micro-CT acquisition. B) Volumetric rendering of individual tumors and the entire liver. Images courtesy of Dr. Kevin Graham, University of Western Ontario.
Figure 9
Figure 9
CT perfusion images of a rat flank 48 days following the implantation of LoVo human colon carcinoma cells (arrow). A) perfusion weighted map is used as the anatomical roadmap for the functional maps: B) blood flow, C) blood volume and D) permeability-surface area product. The perfusion maps were obtained with 150 μm voxels in plane. The slice thickness was 450 μm, which was required to achieve adequate FOV, acquisition speed, and SNR. One 3D image was acquired every second for one minute. Images courtesy of Dr. Ting Lee, Robarts Research Institute, University of Western Ontario.
Figure 10
Figure 10
Combined micro-SPECT and micro-CT, demonstrating bone imaging in a mouse model. Micro-CT data (A,C) was acquired over 220° during continuous gantry rotation, with acquisition parameters of 70 kVp and 88 mAs during a total CT acquisition interval of 130 s. The CT image was reconstructed using a modified Feldkamp cone beam algorithm with short-scan weighting, producing a volume image with 100 μm voxel spacing. Micro-SPECT data (B,C) was obtained in the same imaging session, using a multi-pinhole collimator consisting of seven, 1 mm diameter apertures placed at a fixed radius of 32 mm. SPECT data was acquired over 360° by rotating the collimator through 51 steps; reconstruction was performed with an energy acceptance window of 141 ±14 keV. Sub-millimeter spatial resolution in the SPECT image allows the distinction of metabolic activity within individual vertebrae; note in particular the elevated MDP uptake within joints (knee, shoulder) and in the mandible, as indicated by arrows in (d). At the same time, bone density and morphology is easily quantified using the micro-CT data (A,C). Note that, for clarity, bladder activity has been suppressed in this presentation of the SPECT data. Images courtesy of Dr. Tim Morgan, GE Healthcare, London, Ontario.
Figure 11
Figure 11
Time series images of dynamic DSA study of a rat before (top row) and after (bottom row) phenylephrine injection. Note the dramatic effects of the vasoconstrictor on vascular dynamics as seen in the prolonged blood flow mean transit time, amount of ventricular filling, and the size of the pulmonary arteries and aorta (reproduced from Lin et al., 2006) [permission requested].
Figure 12
Figure 12
A comparison at four selected heartbeats post-contrast injection i.e. (3rd, 4th, 8th, 15th) between DSA and three TDSA planes at 2 mm interval on z axis. A 40° arc was used for TDSA sampling. Note how the depth discrimination reveals the pulmonary vessels (arrows) at z = −4 mm TDSA slice. These vessels are masked by the superposition of other structures, such as the right or left ventricle in the DSA sequence. TDSA allows 4D imaging i.e. both time evolution at heartbeat resolution (horizontal rectangle) and depth discrimination (vertical rectangle). [reproduced with permission from Badea et al.(Badea et al., 2007a)]
Figure 13
Figure 13
A combined micro-CT/DSA study of the fibrosarcoma tumor in a rat. (A) A Maximum Intensity Projection (MIP) of the tumor imaged with Micro-CT and a blood pool contrast agent. (B–D) images are three orthogonal Micro-CT slices through the tumor showing vascular enhancement. (E) Temporal MIP through the DSA data and the 3 perfusion maps i.e. rBV, rBF and rMTT images.

References

    1. Almajdub M, Nejjari M, Poncet G, Magnier L, Chereul E, Roche C, Janier M. In-vivo high-resolution X-ray microtomography for liver and spleen tumor assessment in mice. Contrast Media Mol Imaging. 2007;2:88–93. - PubMed
    1. Badea C, Fubara B, Hedlund L, Johnson G. 4D micro-CT of the mouse heart. Molecular Imaging. 2005;4:110–6. - PubMed
    1. Badea CT, Hedlund LW, Johnson GA. Micro-CT with respiratory and cardiac gating. Medical Physics. 2004;31:3324–9. - PMC - PubMed
    1. Badea CT, Hedlund LW, Lin MD, Boslego JF, Johnson GA. Tumor imaging in small animals with a combined micro-CT/micro-DSA system using iodinated conventional and blood pool contrast agents. Contrast Media and Molecular Imaging. 2006;1:153–64. - PubMed
    1. Badea CT, Hedlund LW, Lin MD, Mackel JS, Samei E, Johnson GA. Tomographic digital subtraction angiography for lung perfusion estimation in rodents. Medical Physics. 2007a;34:1546–55. - PMC - PubMed

Publication types

MeSH terms