. 2008 Sep 1;7(17):2667-73.
doi: 10.4161/cc.7.17.6596. Epub 2008 Sep 28.

Mechanisms of Ras membrane organization and signalling: Ras on a rocker

Affiliations

Mechanisms of Ras membrane organization and signalling: Ras on a rocker

Daniel Abankwa et al. Cell Cycle. .

Abstract

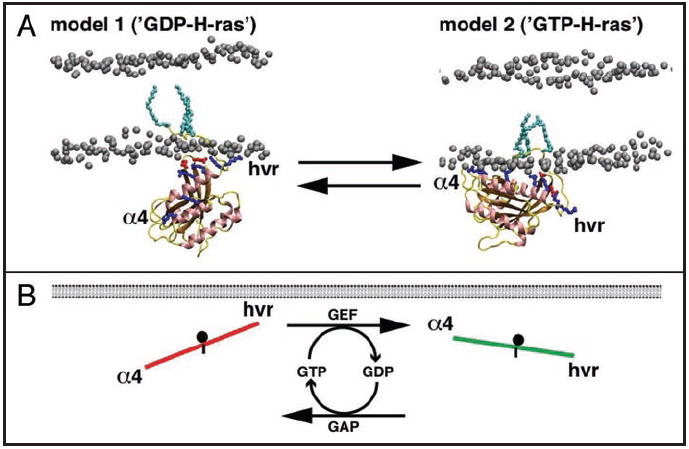
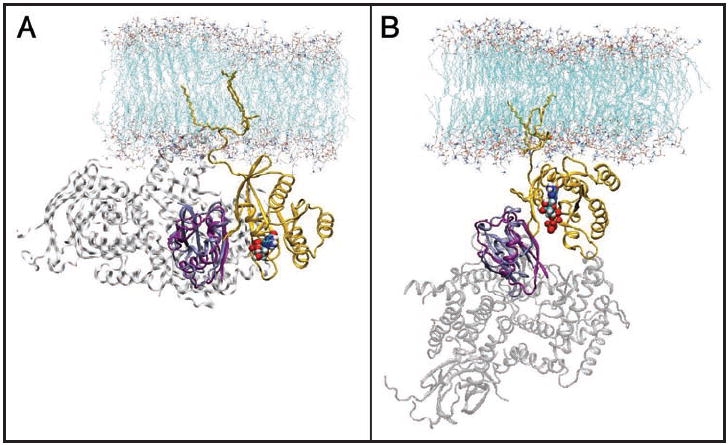
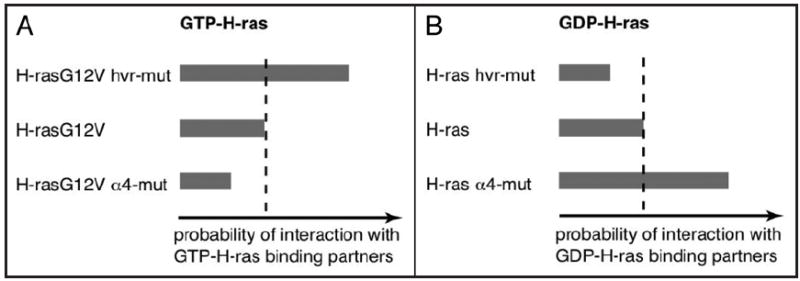
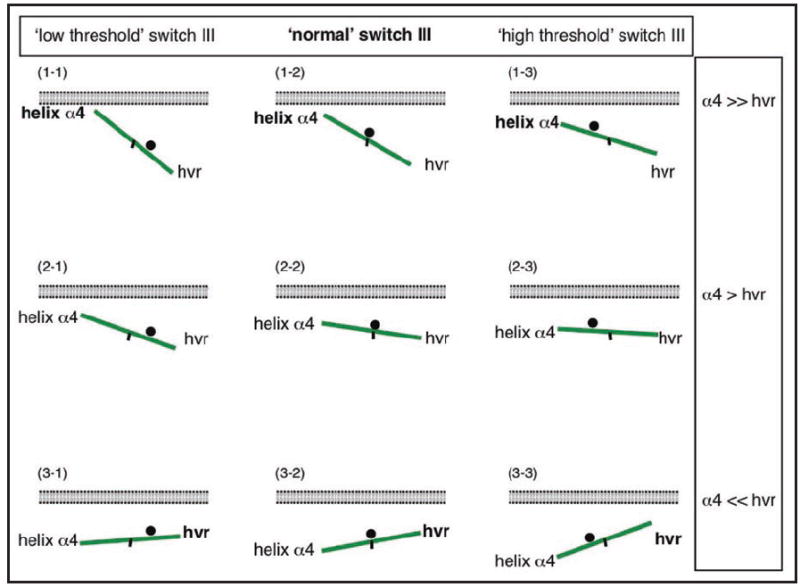
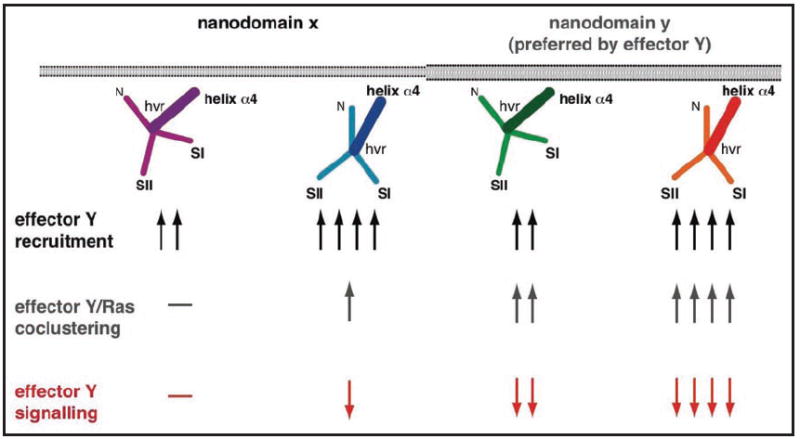
Understanding the signalling function of Ras GTPases has been the focus of much research for over 20 years. Both the catalytic domain and the membrane anchoring C terminal hypervariable region (HVR) of Ras are necessary for its cellular function. However, while the highly conserved catalytic domain has been characterized in atomic detail, the structure of the full-length membrane-bound Ras has remained elusive. Lack of structural knowledge on the full-length protein limited our understanding of Ras signalling. For example, structures of the Ras catalytic domain solved in complex with effectors do not provide a basis for the functional specificity of different Ras isoforms. Recent molecular dynamics simulations in combination with biophysical and cell biological experiments have shown that the HVR and parts of the G domain cofunction with the lipid tails to anchor H-ras to the plasma membrane. In the GTP-bound state, H-ras adopts an orientation that allows read out by Ras effectors and translation into corresponding MAPK signalling. Here we discuss details of an analysis that suggests a novel balance model for Ras functioning. The balance model rationalizes Ras membrane orientation and may help explain isoform specific interactions of Ras with its effectors and modulators.


Figures

Figure 1
Figure 1
The FRET vector approach. (A, top) If a donor labelled probe A is in a different nanodomain from an acceptor labelled nanodomain marker Y, no FRET is observed. If donor and acceptor are randomly distributed, FRET levels remain below 10% (thin blue line in B), even with overexpression at high levels (ca. 2000 eGFP-like acceptors/μm2). (A, middle and bottom) If donor and acceptor are in the same nanodomain FRET is observed, but the FRET level also depends on the density of the acceptor in the nanodomain. Higher acceptor surface density and higher acceptor mole fractions lead to more FRET. (B) The scheme shows the typical dependence of FRET of fluorescently labelled nanoclustered proteins on the acceptor surface density at constant acceptor mole fraction (dots). The maximal FRET value, Emax is determined by curve fitting (red line)., (C) Schematic distribution of probes (stars) over three types of different nanodomains (red, green and blue). Two different distributions for a probe A (left) and a probe B (right) are shown. If these distributions were sequentially interrogated by FRET experiments, as shown in (A and B), the FRET vectors in (D) would be obtained, as probes and nanodomain markers form mixed nanoclusters. (D) Representation of the lateral segregation FRET vectors of probes (A and B) in a nanodomain marker space, as they would follow from their schematical distribution in (C).
Figure 2
Figure 2
Nucleotide dependent reorientation of H-ras. (A) The figure shows the two structural models of H-ras bound to a simple membrane. Model 1 is the conformation preferred by GDP-bound H-ras, while model 2 is preferred by GTP-bound H-ras. The models imply that H-ras exists in a dynamic equilibrium between these two conformations and that the equilibrium can be shifted by the bound nucleotide. The switched elements (α4 and HVR) stabilize the orientations by contacts of specific basic residues (blue sidechains) with the membrane lipids. In model 1, stabilization by the HVR predominates, while in model 2 helix α4 takes over, thus reorienting the whole G domain with respect to the membrane plane. The network of acidic (red sidechains) and basic residues that comprise the novel switch III can be recognized near the membrane (the phosphorus head groups of lipids are shown in grey). (B) The nucleotide dependent orientation of membrane bound H-ras was translated into a simple model, the balance model, which may apply to many Ras isoforms. The sides of the balance represent the switched elements, α4 and the HVR, and the fulcrum (black dot) the switch III. The steepness is a measure of the probability that Ras will interact with its effector. In GDP-H-ras contacts of the HVR prevail, so the HVR side of the balance is ‘up’. On the other hand, helix α4 is ‘up’ in the on-state.
Figure 3
Figure 3
Docking of C-Raf-RBD and PI3Kγ crystal structures onto MD models of H-ras. The Ras catalytic domains co-crystallized with C-Raf (pdb code 1GUA) and PI3Kγ (pdb code 1HE8) were aligned onto the catalytic domain structure from the full-length membrane-bound Ras (orange): (A), model 1 and (B), model 2. The Ras chains of 1GUA and 1HE8 are not shown for clarity. The RBD of C-Raf is in ice blue and that of PI3Kγ in purple. The rest of PI3Kγ structure is shown in grey transparent cartoon. The nucleotide is shown in a space filling model. During the structural alignment, parts of the flexible effector loop (residues 31 to 37 in (A) and 35 to 38 in (B)) clashed with the RBDs (not shown). Binding of the effector would structure most of these residues to become part of an elongated β2, creating a β-sheet that encompasses Ras and the RBD. Note, the sterically more favourable orientation of the complex in (B).
Figure 4
Figure 4
Interaction profiles of H-ras mutants. (A) Mutating specific basic residues in the HVR of H-rasG12V (GTP-H-ras) increases its interaction with the C-Raf-RBD (top). By contrast, mutating specific basic residues on helix α4 decreases the interaction of H-rasG12V with the C-Raf-RBD. These relations may be generalized for all GTP-H-ras interacting proteins (e.g., effectors, scaffolds etc.,). (B) Similarly, it can be expected that GDP-H-ras recognizing protein domains, such as the Cdc25/GEF-domain, interact conversely with the corresponding mutants, i.e., stronger interaction with the helix α4 mutant (α4-mut) and weaker with the hvr-mutant (hvr-mut).
Figure 5
Figure 5
The balance model can be generalized to explain the interactions of GTP-Ras. In the balance model, the steepness of the balance correlates with the probability of a Ras-isoform to interact with e.g., a Ras binding domain of an effector. The same rule may also apply for other GTP-Ras-interacting domains or proteins. The balance can be modulated by different residues in the switched elements, the HVR and helix α4. For example, in (1-1) and (3-1), helix α4 is comparatively ‘heavier’ or ‘lighter’, than in (2-1), respectively. Another way of modulating the balance are isoform specific differences in the remainder of the G domain, which may lead to a shift of the switch III (indicated by the position of the black dot, the fulcrum of the balance). For example, in (2-1) switch III has a lower threshold, so that the same weight of helix α4 leads to a steeper balance (higher probability to reorient), as compared to (2-2). Depending on the exact combination of switch III and the switched elements the balance can be fine tuned. Note, that the balance is working upside down. The black mark at the center of the balances is to provide orientation on the position of the fulcrum (black spot).
Figure 6
Figure 6
Isoform ‘flavours’ can be explained by integrating the balance model and lateral segregation. Experimentally different Ras isoforms show different signalling outputs with a given effector. Lateral segregation of Ras isoforms may account for some of these differences. The scheme shows cartoons of four different GTP-bound Ras isoforms with two different orientations in two different nanodomains. Better access of an effector to switches I and II determines recruitment of the effector from the cytosol (Fig. 3), as indicated by the increasing number of arrows (black arrows). The effector has a preference for nanodomain Y in which it may be preferentially retained and/or activated (grey arrows). Thus combining orientation and lateral segregation of Ras isoforms leads to different, graded signalling output (red arrows).

References

    1. Berney C, Danuser G. FRET or no FRET: a quantitative comparison. Biophys J. 2003;84:3992–4010. - PMC - PubMed
    1. Wolber PK, Hudson BS. An analytic solution to the Forster energy transfer problem in two dimensions. Biophys J. 1979;28:197–210. - PMC - PubMed
    1. Meyer BH, Segura JM, Martinez KL, Hovius R, George N, Johnsson K, Vogel H. FRET imaging reveals that functional neurokinin-1 receptors are monomeric and reside in membrane microdomains of live cells. Proc Natl Acad Sci USA. 2006;103:2138–43. - PMC - PubMed
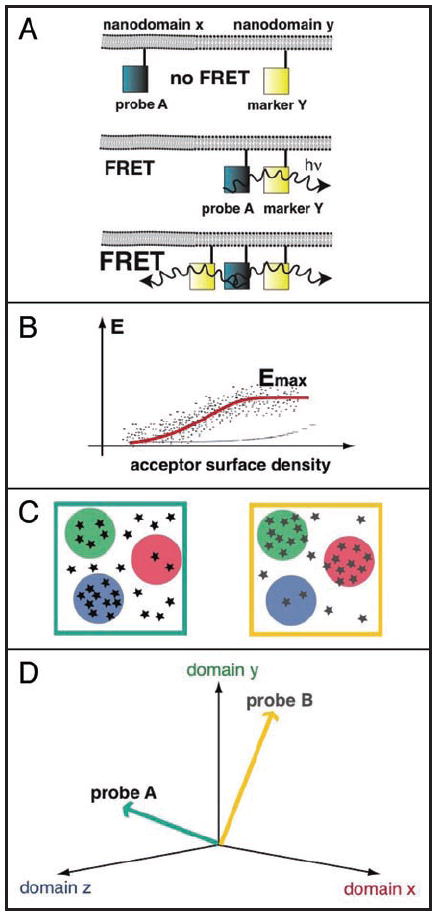
    1. Abankwa D, Vogel H. A FRET map of membrane anchors suggests distinct microdomains of heterotrimeric G proteins. J Cell Sci. 2007;120:2953–62. - PubMed
    1. Abankwa D, Hanzal-Bayer M, Ariotti N, Plowman SJ, Gorfe AA, Parton RG, McCammon JA, Hancock JF. A novel switch region regulates H-ras membrane orientation and signal output. Embo J. 2008;27:727–35. - PMC - PubMed

Publication types