. 2008 Oct;9(10):1148-56.
doi: 10.1038/ni.1648. Epub 2008 Aug 31.

The calcium-activated nonselective cation channel TRPM4 is essential for the migration but not the maturation of dendritic cells

Affiliations

The calcium-activated nonselective cation channel TRPM4 is essential for the migration but not the maturation of dendritic cells

Gaëtan Barbet et al. Nat Immunol. 2008 Oct.

Abstract

Dendritic cell (DC) maturation and migration are events critical for the initiation of immune responses. After encountering pathogens, DCs upregulate the expression of costimulatory molecules and subsequently migrate to secondary lymphoid organs. Calcium (Ca(2+)) entry governs the functions of many hematopoietic cell types, but the role of Ca(2+) entry in DC biology remains unclear. Here we report that the Ca(2+)-activated nonselective cation channel TRPM4 was expressed in and controlled the Ca(2+) homeostasis of mouse DCs. The absence of TRPM4, which elicited Ca(2+) overload, did not influence DC maturation but did considerably impair chemokine-dependent DC migration. Our results establish TRPM4-regulated Ca(2+) homeostasis as crucial for DC mobility but not maturation and emphasize that DC maturation and migration are independently regulated.


Figures
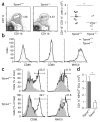
Figure 1
Figure 1
DC populations in TRPM4-deficient and littermate control mice. (a) Staining profiles (left) and absolute numbers (right) of splenic CD11c+CD11b+ DCs from TRPM4-deficient mice (Trpm4−/−) and control mice (Trpm4+/+). Numbers adjacent to outlined areas (left) indicate percent CD11c+CD11b+ cells. Each symbol (right) represents an individual mouse; small horizontal lines indicate the mean. (b) Flow cytometry of the expression of costimulatory markers on spleen DCs from TRPM4-deficient and control mice. (c) Flow cytometry of the expression of CD86 and MHC class II molecules (MHCII) on popliteal lymph node DCs in steady-state conditions (filled histograms) and 24 h after subcutaneous injection of E. coli (bold lines). Numbers above bracketed lines indicate percent CD86+ cells (left) or MHC class II-high cells (right). (d) Absolute numbers of CD11c+, MHC class II-high (MHCIIhi) DCs in popliteal lymph nodes 24 h after subcutaneous injection of E. coli into TRPM4-deficient and control mice. *, P < 0.01. Data are representative of ten (a,b) or six (c,d) independent experiments (error bars (d), s.e.m.).
Figure 2
Figure 2
Impaired migration of DCs in Trpm4−/− mice. (a) Flow cytometry of CD11c+ gated cells from lymph nodes of Trpm4−/− and littermate control mice painted with a 1% solution of FITC on the back skin 2 h before the addition of E. coli by scarification. Left, numbers above outlined areas indicate percent FITC+CD11c+ cells in draining (brachial) lymph nodes 12 h after scarification. FSC, forward scatter. Right, absolute numbers of FITC+CD11c+ cells at 12, 24 and 48 h in draining (brachial) lymph nodes and nondraining (mesenteric) lymph nodes. (b) Immunohistochemistry of uninflamed skin from Trpm4−/− and control mice stained with anti-CD11c and counterstained with hematoxylin. Arrowheads indicate CD11c+ cells. Original magnification, ×400. (c) Flow cytometry of a 1:1 mixture of iDCs from Trpm4−/− mice (CFSElo) and control mice (CFSEhi) before and after injection into the footpads of recipient mice at 2 h before E. coli inoculation (top row); far right, BMDCs detected in popliteal lymph nodes of recipients at 12 h after E. coli footpad injection. Number adjacent to outlined area (far left) indicates percent CFSE+ cells from popliteal lymph nodes; numbers above bracketed lines (middle) and below outlined areas (right) indicate percent CFSElo cells (left) or CFSEhi cells (right). SSC, side scatter. Below, absolute numbers of migrated BMDCs in popliteal lymph nodes of mice with (left) or without (right) E. coli injection. *, P < 0.05; **, P < 0.01. Data are representative of at least three independent experiments (error bars (a,c), s.e.m.).
Figure 3
Figure 3
A TRPM4-like current is present in Trpm4+/+ BMDCs but not in Trpm4−/− BMDCs. (a) Current-voltage relationships recorded in Trpm4+/+ and Trpm4−/− BMDCs in the whole-cell patch-clamp configuration. The pipette solution contained mainly potassium glutamate (K-glut) with 1 μM Ca2+; the external solution contained mainly sodium gluconate (Na-gluc). The reversal potential was −43.98 ± 15.72 mV in Trpm4+/+ DCs and −79.72 ± 5.08 mV in Trpm4−/− DCs (P = 0.032). The diamond curve results from subtraction of the Trpm4+/+ values from the Trpm4−/− values. HP, holding potential; VM, membrane potential. (b-g) Inside-out recordings. (b) Current-voltage curve obtained with both pipette and bath containing a standard solution of 145 mM NaCl with 1 mM CaCl2. Points were fitted by linear regression to determine conductance (g 22.1 ± 0.6 pS). Inset, current traces at various voltages; dashed line, closed channel. (c) Current-voltage curves in 145 mM KCl (conductance, 22.3 ± 1.4 = pS; reversal potential, 1.7 ± 1.2 mV; K+ permeability/Na+ permeability, 0.95 ± 0.04) or in 42 mM NaCl (open circles); points were fitted by the Goldman-Hodgkin-Katz equation (reversal potential, 22.3 ± 1.5 mV; Cl permeability/Na+ permeability, 0.11). (d) Channel voltage dependence, showing the open probability (Po) determined at various voltages in experiments identical to that in b. (e) Open probability at various [Ca2+]i values (VM +40 mV). Points were fitted with the Hill equation, which provided a half-maximum effector concentration of 14 μM. (f) Effect of [Ca+]i on unitary channel =activity (VM +40 mV). c, closed state of the channel; o, open state of the channel. (g) Effect of internal ATP on an inside-out patch. o1, open state of one channel;=o2, open state of two channels. Right, effect of ATP on the open probability. *, P < 0.01. Data are representative of at least five (a,d) or four (b,c,e–g) independent experiments (error bars (c–e,g), s.e.m.).
Figure 4
Figure 4
Trpm4 is the main DC CAN channel regulating Ca2+ signaling. (a) Entry of Ca2+ into iDCs after activation by ECS, assessed in Trpm4+/+ BMDCs (n = 46 cells) and Trpm4−/− BMDCs (n = 51 cells). Area under the curve in arbitrary units (AU): 22.23 ± 1.82 AU, Trpm4+/+; 33.58 ± 2.36 AU, Trpm4−/−; P = 0.0003. Iono, ionomycin. (b) Ca2+ signaling in Trpm4+/+ iDCs (n = 54) and Trpm4−/− iDCs (n = 104) after ECS stimulation in Ca2+-free solution (5 mM EGTA) with the subsequent addition of 2 mM Ca2+. Area under the curve: 102.38 ± 9.86 AU, Trpm4 = +/+; 139.71 ± 7.42 AU, Trpm4−/−; P = 0.003. (c) Ca2+ signals in Trpm4+/+ BMDCs with or without pretreatment with pertussis toxin: 14.07 ± 2.52 AU with pertussis toxin (n = 28 cells); 35.33 ± 3.51 AU without pertussis toxin (Control; n = 26 cells); P = 0.00001. (d) Ca2+ signals in Trpm4+/+ BMDCs with or without TAK-779 treatment: 15.15 ± 2.48 AU with TAK-779 (n = 43 cells); 27.6 ± 2.52 AU without TAK-779 (Control; n = 32 cells); P = 0.0009. (e) RT-PCR of the expression of Trpm4 and TRPM5 mRNA in BMDCs. Rps15, small ribosomal protein (positive control); H2O, no DNA. bp, base=pairs. (f) Quantitative RT-PCR of the expression of Trpm4 and Trpm5 in Trpm4+/+ and Trpm4−/− BMDCs, presented relative to the expression of Rps14 (which decodes ribosomal protein 14). (g) Ca2+ signals in Trpm4+/+Trpm5−/− BMDCs (25.6 ± 4 AU; n = 24 cells) and Trpm4−/−Trpm5−/− BMDCs (38.6 ± 2.3 AU; n = 28 cells); P = 0.006. P = 0.375, wild-type (Trpm4+/+Trpm5+/+) versus Trpm4+/+Trpm5−/−; P = 0.168, Trpm4−/−Trpm5+/+ versus Trpm4−/−Trpm5−/−. (h) Flow cytometry of steady-state splenic DCs. Numbers above outlined areas indicate percent CD11c+CD11b+ cells. Data are representative at least three independent experiments (error bars (f), s.e.m.).
Figure 5
Figure 5
Identical differentiation and maturation of Trpm4−/− and Trpm4+/+ BMDCs. (a) Generation of CD11c+-CD11b+ BMDCs during in vitro culture. Gray shading indicates the culture period during which BMDCs were used for experiments. (b,c) Flow cytometry of the surface phenotypes of Trpm4+/+ and Trpm4−/−BMDCs before (iDC) and after (mDC) 24 h of stimulation with LPS (b) or fixed E. coli (c). Data are representative of three independent experiments (error bars (a), s.e.m.).
Figure 6
Figure 6
Greater mobility but less chemotaxis of Trpm4−/− iDCs. (a) Time-lapse video microscopy (4 h) of the mobility of Trpm4+/+ iDCs (n = 26) and Trpm4−/− iDCs (n = 25) after stimulation with fixed E. coli (left); colored lines indicate the movement of single cells every 5 min. Scale bars, 100 μm. Right, mean distance. (b,c) Transwell migration of Trpm4+/+ and Trpm4−/− BMDCs triggered by CCL21 (25 ng/ml) after 24 h of maturation with fixed E. coli (b) or LPS (c), assessed as the ratio of chemotaxis with CCL21/chemotaxis without CCL21. P = 0.0008, fixed E. coli versus LPS for Trpm4−/− BMDCs; P = 0.087, fixed E. coli versus LPS for Trpm4+/+ BMDCs. (d) In vivo migration of Trpm4−/− (CFSElo) and control (CFSEhi) iDCs injected as a 1:1 mixture into the footpads of recipient mice 2 h before LPS injection (50 ng/footpad), presented as the absolute number of migrated BMDCs of each genotype in popliteal (Draining) and brachial (Nondraining) lymph nodes 24 h after LPS injection. *, P < 0.05; **, P < 0.01; ***, P o 0.001. Data are representative of at least three independent experiments (error bars, s.e.m.).
Figure 7
Figure 7
PLC-β2 downregulation induced by Ca2+ overload in Trpm4−/− DCs. (a) Ca2+ signals after ECS stimulation of Trpm4+/+ BMDCs (122.82 ± 12.43 AU; n = 57 cells) and Trpm4−/− BMDCs (68.93 ± 6.13 AU; n = 64 cells) matured by stimulation with fixed E. coli. P = 0.0001. = (b) Ca2+ signals after CCL21 stimulation of Trpm4+/+ and Trpm4−/− BMDCs matured with fixed E. coli (19.31 ± 4.59 AU, Trpm4+/+; 8.58 ± 6.49 AU, Trpm4−/−; P = 0.038). (c) Ca2+ signals after ECS stimulation of Trpm4+/+ mDCs (80.9 ± 10.5 AU; n = 70 cells) and Trpm4−/− mDCs (48.6 ± 8.6 AU; n = 57 cells) in the absence of external Ca2+. P = 0.0007. (d) CCL21-mediated Ca2+ responses of Trpm4+/+ and Trpm4−/− BMDCs matured with E. coli in the presence of EGTA. (e) PLC-β2 protein expression = in Trpm4+/+ (+/+) and Trpm4−/− (−/−) BMDCs before (iDC) and after E. coli maturation or after 24 h of incubation with ionomycin (1 μM). Right, PLC-β2 expression relative to that of b-actin, normalized to iDC values. *, P < 0.05; **, P < 0.01. (f) Expression of PLC-γ1 and PLC-γ2 in Trpm4+/+ and Trpm4−/− BMDCs before and after Ca2+-dependent maturation. β-actin serves as a loading control. Data are representative of three (a,c,f), at least five (b,d), or eleven (e) independent experiments (error bars (e), s.e.m.).

Similar articles

Cited by

References

    1. Steinman RM, Hawiger D, Nussenzweig MC. Tolerogenic dendritic cells. Annu. Rev. Immunol. 2003;21:685–711. - PubMed
    1. Bonasio R, von Andrian UH. Generation, migration and function of circulating dendritic cells. Curr. Opin. Immunol. 2006;18:503–511. - PubMed
    1. Banchereau J, Palucka AK. Dendritic cells as therapeutic vaccines against cancer. Nat. Rev. Immunol. 2005;5:296–306. - PubMed
    1. Naik SH. Demystifying the development of dendritic cell subtypes, a little. Immunol. Cell Biol. 2008;86:439–452. - PubMed
    1. Lewis RS. Calcium signaling mechanisms in T lymphocytes. Annu. Rev. Immunol. 2001;19:497–521. - PubMed

Publication types

MeSH terms