. 2009 Feb;29(1):133-40.
doi: 10.1007/s10571-008-9305-y. Epub 2008 Aug 30.

Evaluation of insulin and ascorbic acid effects on expression of Bcl-2 family proteins and caspase-3 activity in hippocampus of STZ-induced diabetic rats

Affiliations

Evaluation of insulin and ascorbic acid effects on expression of Bcl-2 family proteins and caspase-3 activity in hippocampus of STZ-induced diabetic rats

Iraj Jafari Anarkooli et al. Cell Mol Neurobiol. 2009 Feb.

Abstract

Aims: Effects of insulin and ascorbic acid on expression of Bcl-2 family proteins and caspase-3 activity in hippocampus of diabetic rats were evaluated in this study.

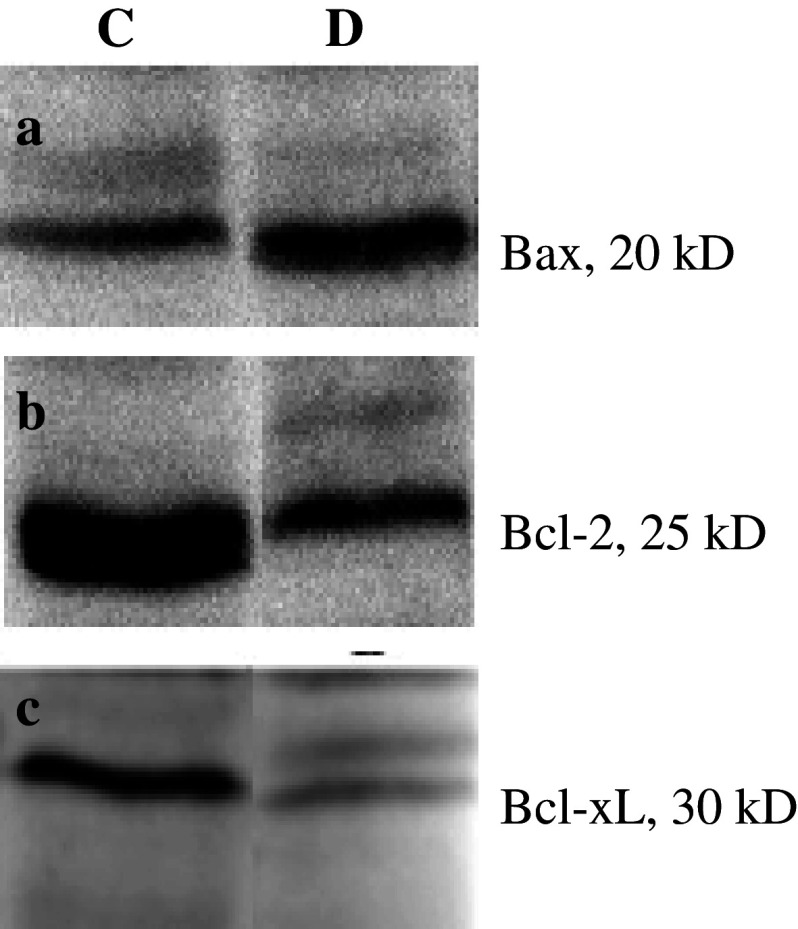
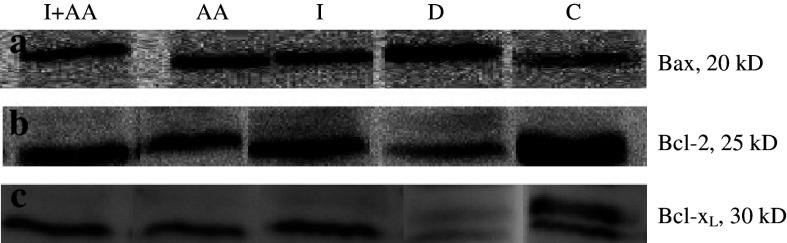
Methods: Diabetes was induced in Wistar male rats by streptozotocin (STZ). Six weeks after verification of diabetes, the animals were treated for 2 weeks with insulin or/and ascorbic acid in separate groups. Hippocampi of rats were removed and evaluation of Bcl-2, Bcl-x(L), and Bax proteins expression in frozen hippocampi tissues were done by SDS-PAGE electrophoresis and blotting. The Bcl-2, Bcl-x(L), and Bax proteins bands were visualized after incubation with specific antibodies using enhanced chemiluminescences method. Caspase-3 activity was determined using the caspase-3/CPP32 Fluorometric Assay Kit.

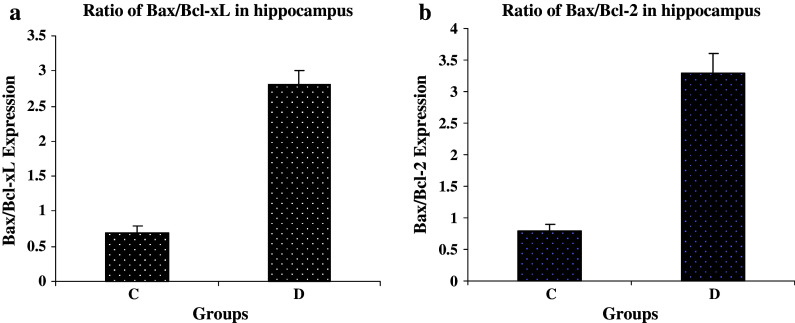
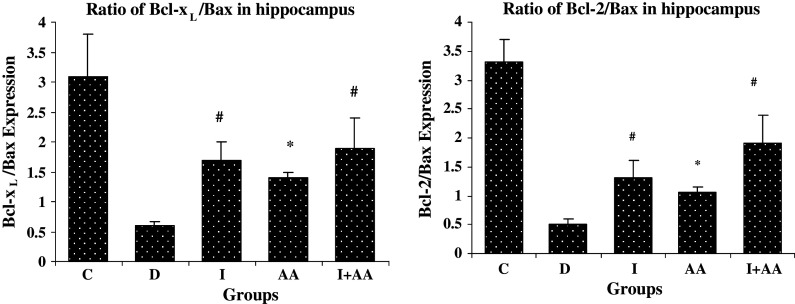
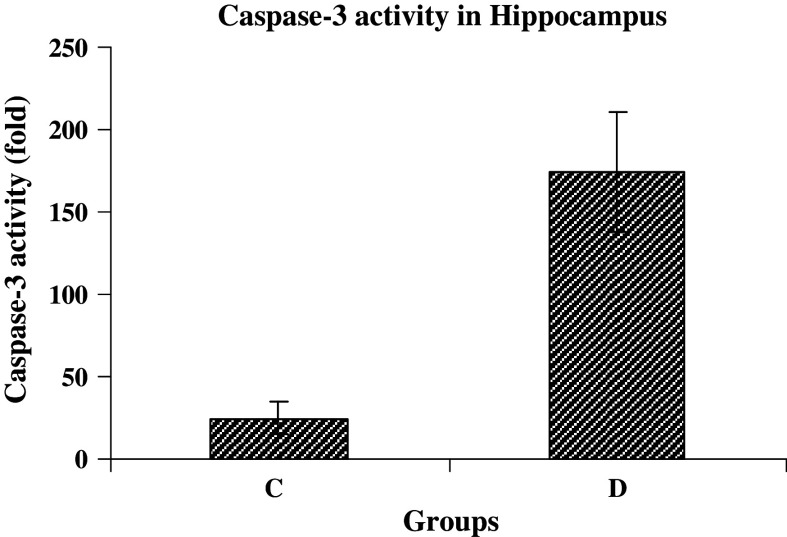
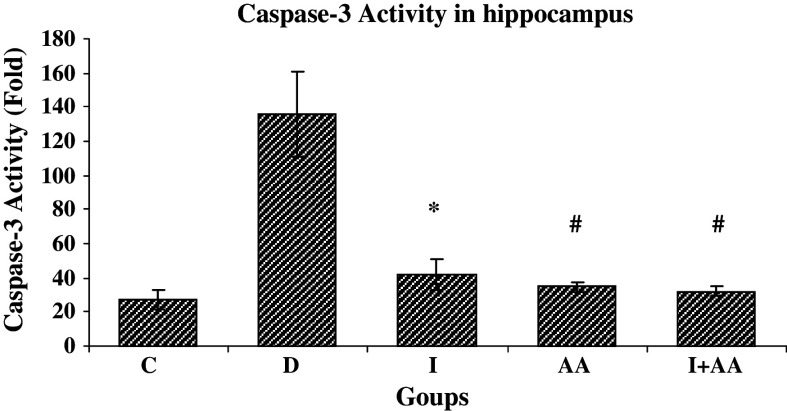
Results: Diabetic rats showed increase in Bax protein expression and decrease in Bcl-2 and Bcl-x(L) proteins expression. The Bax/Bcl-2 and Bax/Bcl-x(L) ratios were found higher compared with non-diabetic control group. Treatments with insulin and/or ascorbic acid were resulted in decrease in Bax protein expression and increase in Bcl-2 and Bcl-x(L) proteins expression. The Bcl-2/Bax and Bcl-x(L)/Bax ratios were found higher in treated groups than untreated diabetic group. Caspase-3 activity level was found higher in diabetic group compared with non-diabetic group. Treatment with insulin and ascorbic acid did downregulated caspase-3 activity.

Conclusions: Our data provide supportive evidence to demonstrate the antiapoptotic effects of insulin and ascorbic acid on hippocampus of STZ-induced diabetic rats.


Figures

Fig. 1
Fig. 1
Analysis of Bcl-2, Bcl-xL, and Bax proteins expression in frozen hippocampi of rats groups C (Control) and D (Diabetic) by western blotting. (a) Bax gene expression, the level of expression of Bax in group D showed increase significantly compared with group C, (b) Bcl-2 gene expression, and (c) Bcl-xL gene expression, the levels of Bcl-2 and Bcl-xL were found lower in group D than group C
Fig. 2
Fig. 2
Analysis of Bcl-2, Bcl-xL, and Bax proteins expression in frozen hippocampi of rats groups C (Control), D (Diabetic), I (treated with insulin), AA (treated with ascorbic acid), and I + AA (treated with insulin + ascorbic acid) by western blotting. (a) Bax gene expression, the level of expression of Bax in groups I, AA, and I + AA showed decrease significantly compared with group D, (b) Bcl-2 gene expression, and (c) Bcl-xL gene expression, the levels of Bcl-2 and Bcl-xL were found higher in groups I, AA, and I + AA compared to the group D
Fig. 3
Fig. 3
Bax/Bcl-xL and Bax/Bcl-2 expression ratios in hippocampus tissue of control (C) and STZ-induced diabetic (D) groups of rat. (a) Bar graph indicates the mean ± SEM of Bax/Bcl-xL ratio. < 0.001, compared to the control group (n = 3 each group). (b) Bar graph indicates the mean ± SEM of Bax/Bcl-2 ratio. P < 0.01, compared to the control group (n = 3 each group)
Fig. 4
Fig. 4
The effects of insulin and ascorbic acid on Bcl-xL/Bax and Bcl-2/Bax expression ratios in hippocampal tissue of rats. Bar graph indicates the mean ± SEM. # P < 0.001, * P < 0.01 compared to the D group (n = 3 each group)
Fig. 5
Fig. 5
Caspase-3 activity in hippocampal tissues of control (C) and STZ-induced diabetic (D) rat groups (n = 3 each group). Bar graph indicates the mean ± SEM P < 0.001, compared to the control group)
Fig. 6
Fig. 6
Caspase-3 activity in hippocampal tissues rats groups C (Control), D (Diabetic), I (treated with insulin), AA (treated with ascorbic acid), and I + AA (treated with insulin + ascorbic acid) (= 3 each group). Caspase-3 activity in groups I, AA, and I + AA showed decrease significantly compared with group D. Bar graph indicates the mean ± SEM, # P < 0.001, * P < 0.01 compared with group D

Similar articles

Cited by

References

    1. Ahn YH, Kim YH, Hong SH, Koh JY (1998) Depletion of intracellular zinc induces protein synthesis-dependent neuronal apoptosis in mouse cortical culture. Exp Neurol 154:47–56. doi:10.1006/exnr.1998.6931 - PubMed
    1. Allen DA, Yaqoob MM, Harwood SM (2005) Mechanisms of high glucose-induced apoptosis and its relationship to diabetic complications. J Nutr Biochem 16:705–713. doi:10.1016/j.jnutbio.2005.06.007 - PubMed
    1. Aragno M, Mastrocola R, Brignardello E, Catalano M, Robino G, Manti R, Parola M, Danni O, Boccuzzi G (2002) Dehydroepiandrosterone modulates nuclear factor-kappaB activation in hippocampus of diabetic rats. Endocrinology 143:3250–3258. doi:10.1210/en.2002-220182 - PubMed
    1. Ashkenazi A, Dixit VM (1998) Death receptors: signaling and modulation. Science 281:1305–1308. doi:10.1126/science.281.5381.1305 - PubMed
    1. Bar-Am O, Weinreb O, Amit T, Youdim MB (2005) Regulation of Bcl-2 family proteins, neurotrophic factors, and APP processing in the neurorescue activity of propargylamine. FASEB J 19:1899–1901 - PubMed

Publication types

MeSH terms