

A Bayesian approach to modeling associations between pulsatile hormones
- PMID: 18759850
- PMCID: PMC2845528
- DOI: 10.1111/j.1541-0420.2008.01117.x
A Bayesian approach to modeling associations between pulsatile hormones
Abstract
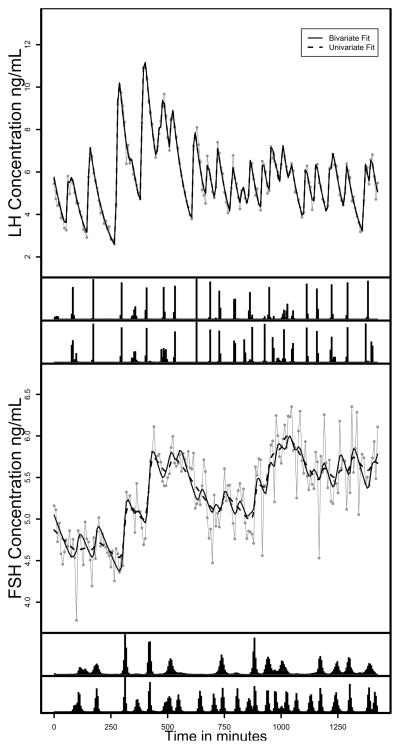
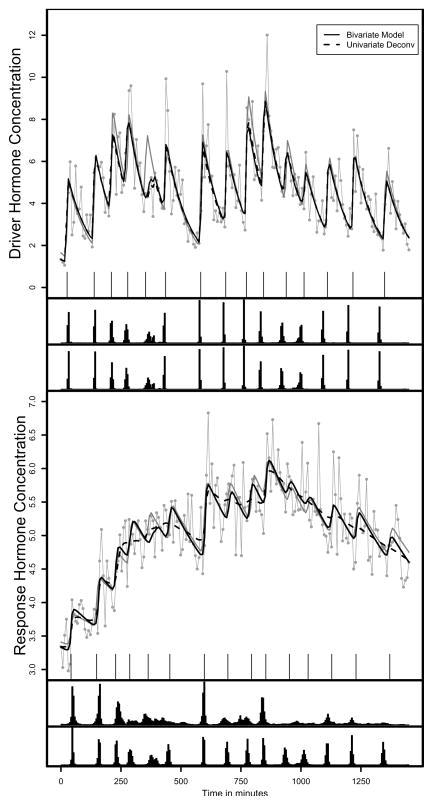
Many hormones are secreted in pulses. The pulsatile relationship between hormones regulates many biological processes. To understand endocrine system regulation, time series of hormone concentrations are collected. The goal is to characterize pulsatile patterns and associations between hormones. Currently each hormone on each subject is fitted univariately. This leads to estimates of the number of pulses and estimates of the amount of hormone secreted; however, when the signal-to-noise ratio is small, pulse detection and parameter estimation remains difficult with existing approaches. In this article, we present a bivariate deconvolution model of pulsatile hormone data focusing on incorporating pulsatile associations. Through simulation, we exhibit that using the underlying pulsatile association between two hormones improves the estimation of the number of pulses and the other parameters defining each hormone. We develop the one-to-one, driver-response case and show how birth-death Markov chain Monte Carlo can be used for estimation. We exhibit these features through a simulation study and apply the method to luteinizing and follicle stimulating hormones.
Figures
References
-
- Cappé O, Robert CP, Ryden T. Reversible jump MCMC converging to birth-and-death MCMC and more general continuous time samplers. 2002. http://www.statslab.cam.ac.uk/mcmc/
-
- Clarke IJ, Cummins JT. The temporal relationship between gonadotropin releasing hormone (GnRH) and luteinizing hormone (LH) secretion in ovariectomized ewes. Endocrinology. 1982;111:1737–9. - PubMed
-
- Clarke IJ, Cummins JT, Findlay JK, Burman KJ, Doughton BW. Effects on plasma luteinizing hormone and follicle-stimulating hormone of varying the frequency and amplitude of gonadotropin-releasing hormone pulses in ovariectomized ewes with hypothalamo-pituitary disconnection. Neuroendocrinology. 1984;39:214–221. - PubMed
-
- Diggle P. Time Series: A Biostatistical Introduction. New York: Oxford University Press; 1990.
-
- Dorin RI, Ferries LM, Roberts B, Qualls CR, Veldhuis JD, Lisansky EJ. Assessment of stimulated and spontaneous adrenocorticotropin secretory dynamics identifies distinct components of cortisol feedback inhibition in healthy humans. Journal of Clinical Endocrinology and Metabolism. 1996;81:3883–91. - PubMed
