. 2008 Aug 29:4:12.
doi: 10.1186/1746-1448-4-12.

Heterologous ectoine production in Escherichia coli: by-passing the metabolic bottle-neck

Affiliations

Heterologous ectoine production in Escherichia coli: by-passing the metabolic bottle-neck

Thorsten Bestvater et al. Saline Syst. .

Abstract

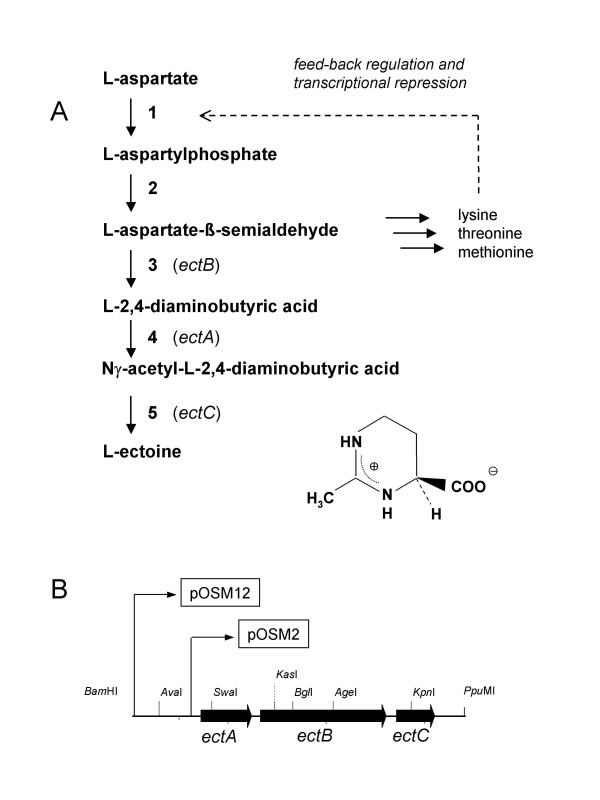
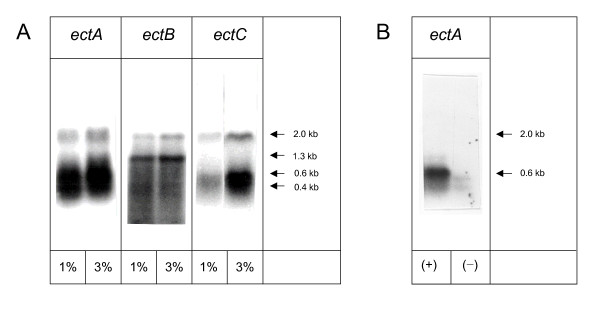
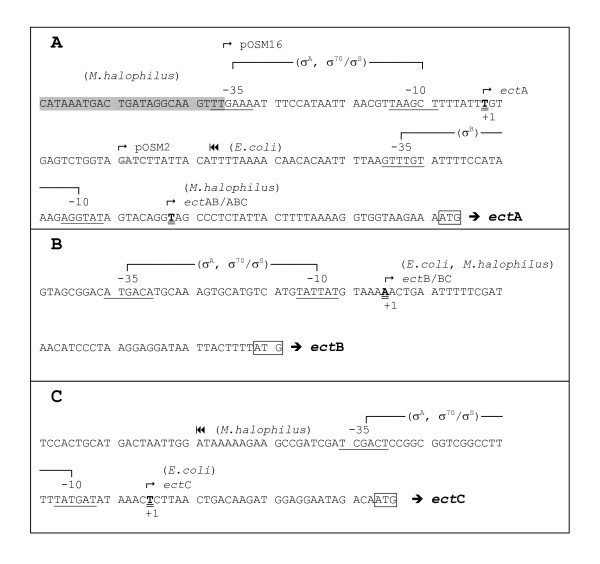
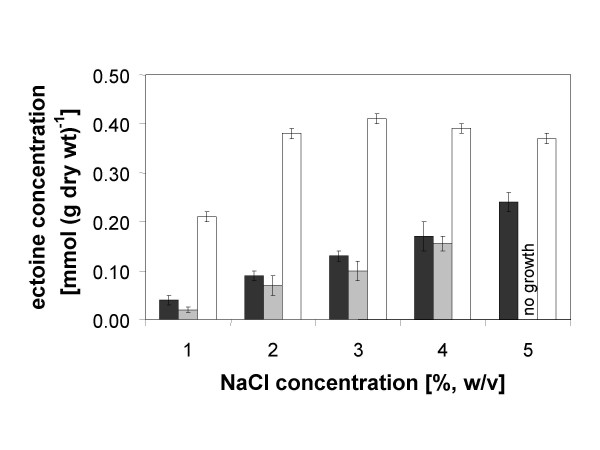
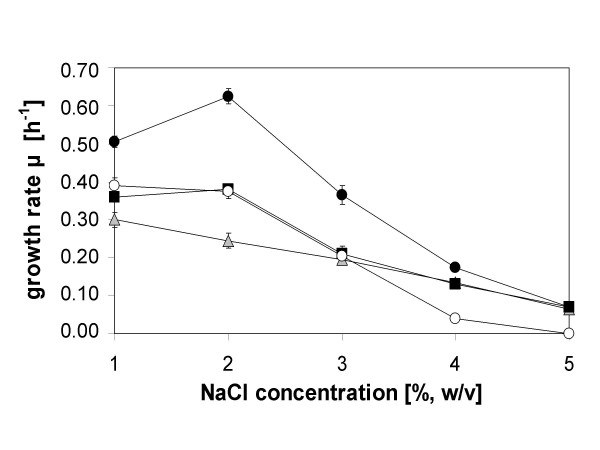
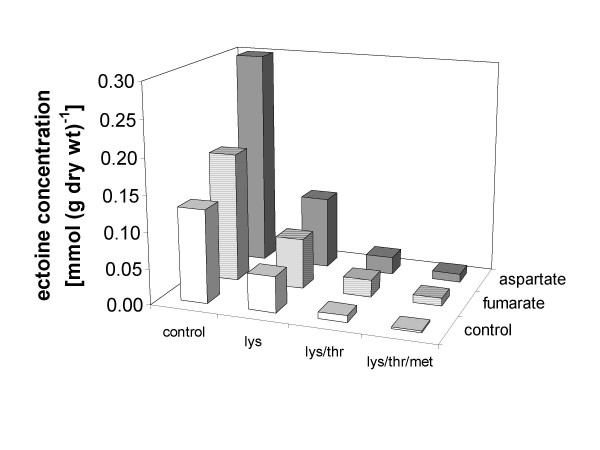
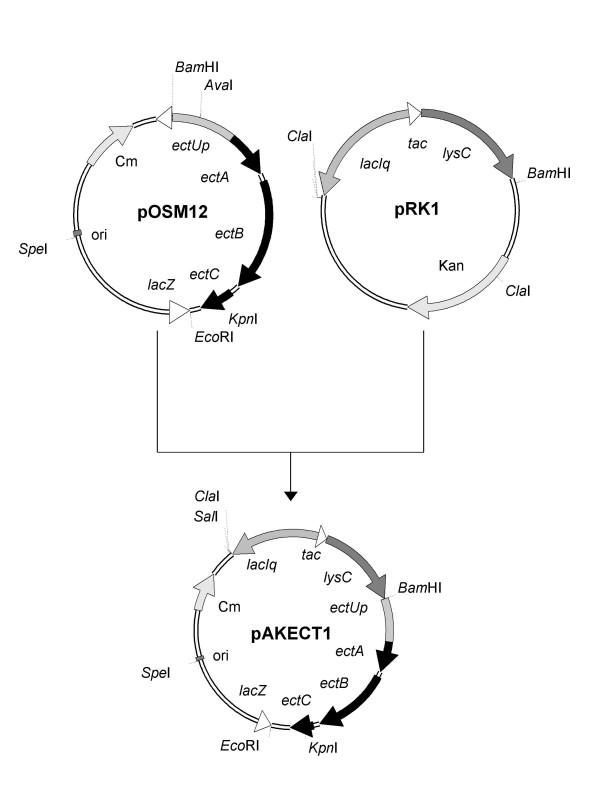
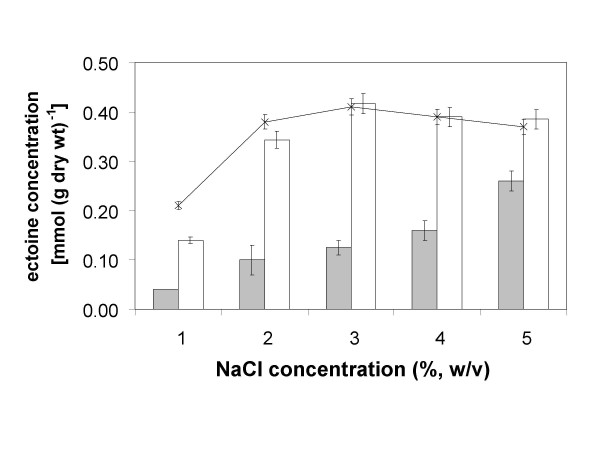
Transcription of the ectoine biosynthesis genes ectA, ectB and ectC from Marinococcus halophilus in recombinant Escherichia coli DH5alpha is probably initiated from three individual sigma70/sigmaA-dependent promoter sequences, upstream of each gene. Consequently, mRNA-fragments containing the single genes and combinations of the genes ectA and ectB or ectB and ectC, respectively, could be detected by Northern blot analysis. Under the control of its own regulatory promoter region (ectUp) a seemingly osmoregulated ectoine production was observed. In addition, aspartate kinases were identified as the main limiting factor for ectoine production in recombinant E. coli DH5alpha. Co-expression of the ectoine biosynthesis genes and of the gene of the feedback-resistant aspartate kinase from Corynebacterium glutamicum MH20-22B (lysC) led to markedly increased production of ectoine in E. coli DH5alpha, resulting in cytoplasmic ectoine concentrations comparable to those reached via ectoine accumulation from the medium.


Figures

Figure 1
Figure 1
Ectoine biosynthesis and ectABC gene cluster from Marinococcus halophilus. A: The biosynthetic pathway for ectoine [56,57] and its dependence on feed-back regulation and/or transcriptional repression of the aspartate kinases in the biosynthetic pathway of the amino acids L-lysine, L-threonine and L-methionine during heterologous expression in E. coli. B: Map of the ectoine biosynthetic genes from M. halophilus as integrated in the plasmids pOSM12 and pOSM2 (only some restriction sites are shown). In case of pOSM2 the natural promoter region upstream of ectA is truncated and replaced by a lac promoter. 1, L-aspartate-kinase I-III; 2, L-aspartate-β-semialdehyde dehydrogenase; 3, L-2,4-diaminobutyric acid transaminase (ectB); 4, L-2,4-diaminobutyric acid Nγ-acetyltransferase (ectA); 5, L-ectoine synthase (ectC).
Figure 2
Figure 2
Northern blot analysis. Northern blot analysis of total RNA isolated from E. coli DH5α pOSM12 at 1% and 3% NaCl (A) and from E. coli DH5α pOSM2 at 3% NaCl (B) in minimal medium MM63 was performed with specific RNA probes for each of the ectoine genes ectA, ectB and ectC (0.4 kb = ectC, 0.6 kb = ectA, 1.3 kb = ectB, 1.8 kb = ectBC, 2.0 kb = ectAB). Arrows indicate where mRNA bands matching the calculated size of gene should be located. (+) and (-) refer to presence and absence of IPTG.
Figure 3
Figure 3
Transcription initiation sites and putative promoter regions. Transcription initiation sites and positions of putative σA, σB- and σ70S-dependent promoters upstream of ectA (A), ectB (B) and ectC (C). The -35 and -10 regions are underlined and the start codons ATG are framed. The transcription initiation sites as determined by RACE are typed bold, underlined twice and marked (+1). The DNA sequence upstream ectA which is deleted in pOSM16 (see text) is underlayed grey. The Sau3A restriction site used for the construction of pOSM2 (↱pOSM2) is marked. |◀◀: last nucleotide of the cDNA fragment from RACE experiment, which was terminated 89 bp upstream of the start codon of ectA (for E. coli) and 83 bp upstream of ectC (for M. halophilus) (see text).
Figure 4
Figure 4
Intracellular ectoine content (heterologous production vs. uptake). Intracellular ectoine concentrations of the recombinant ectoine producers E. coli DH5α pOSM12 (black bars) and pOSM2 (grey bars), the latter supplemented with IPTG for induction of the lac promoter upstream of ectA, and of the control strain E. coli DH5α pHSG575, supplemented with 2 mM ectoine in the growth medium, (white bars) at salinities between 1% and 5% NaCl in minimal medium MM63. Mean values and standard deviations are based on three independent experiments.
Figure 5
Figure 5
Maximum growth rates. Maximum growth rates [h-1] of the recombinant ectoine producer E. coli DH5α pOSM12 (▲) and of the control strain E. coli DH5α pHSG575, with (●) and without (○) supplementation of 2 mM ectoine at salinities of between 1% and 5% NaCl in minimal medium MM63. The novel construct pAKECT1 (■) employing deregulated aspartate kinase from C. glutamicum (induced with 0.5 mM IPTG) displayed improved growth at salinities above 3% NaCl. Mean values and standard deviations are based on three independent experiments.
Figure 6
Figure 6
Influence of feed-back inhibitors and precursors. Intracellular ectoine concentrations of E. coli DH5α pOSM12 in minimal medium MM63 at 3% NaCl, as influenced by supplementation with the feedback-inhibitors and transcriptional repressors L-lysine (lys), L-threonine (thr) and L-methionine (met) (each 1 mM), or with the substrate L-aspartate (1 mM) and its precursor fumarate (1 mM). Control experiments were performed in the absence of regulating amino acids.
Figure 7
Figure 7
Construction of the plasmids pAKECT1. Plasmid pAKECT1 (10.1 kb) was constructed from pOSM12 and pRK1. Only donor plasmids, final construct and the relevant restriction sites are shown. Due to lack of suitable restriction sites, a complex construction scheme had to be applied (details in text). ectUp: region upstream of ectA with putative osmoregulated promoter sequences. lysC: deregulated aspartate kinase from Corynebacterium glutamicum MH20-22B.
Figure 8
Figure 8
Improved intracellular ectoine content in E. coli DH5α pAKECT1. Intracellular ectoine concentrations of the new recombinant ectoine producer E. coli DH5α pAKECT1 with (white bars) and without (grey bars) IPTG-induction of the feedback-insensitive aspartate kinase at salinities between 1% and 5% NaCl in minimal medium MM63. For sake of comparison the data obtained with the control strain E. coli DH5α pHSG575, supplemented with 2 mM ectoine in the growth medium, are added to the graph as a solid line. Mean values and standard deviations are based on three independent experiments.

References

    1. Brown AD. Bacterial water stress. Bact Rev. 1990;40:803–846. - PMC - PubMed
    1. da Costa MS, Santos H, Galinski EA. An overview of the role and diversity of compatible solutes in bacteria and archaea. Adv Biochem Eng Biotechnol. 1998;61:117–153. - PubMed
    1. Bremer E, Krämer R. In: Bacterial Stress Responses. Storz G, Hengge-Aronis R, editor. Washington D.C.: ASM Press; 2000. Coping with osmotic challenges: osmoregulation through accumulation and release of compatible solutes; pp. 79–97.
    1. Galinski EA, Pfeiffer HP, Trüper HG. 1,4,5,6-Tetrahydro-2-methyl-4-pyrimidine carboxylic acid: A novel cyclic amino acid from halophilic phototrophic bacteria of the genus Ectothiorhodospira. Eur J Biochem. 1985;149:135–139. - PubMed
    1. Severin J, Wohlfahrt A, Galinski EA. The predominant role of recently discovered tetrahydropyrimidines for the osmoadaptation of halophilic eubacteria. J Gen Microbiol. 1992;138:1629–1638.