. 2008 Sep;83(3):322-36.
doi: 10.1016/j.ajhg.2008.08.001. Epub 2008 Aug 28.

A genome-wide analysis of admixture in Uyghurs and a high-density admixture map for disease-gene discovery

Affiliations

A genome-wide analysis of admixture in Uyghurs and a high-density admixture map for disease-gene discovery

Shuhua Xu et al. Am J Hum Genet. 2008 Sep.

Abstract

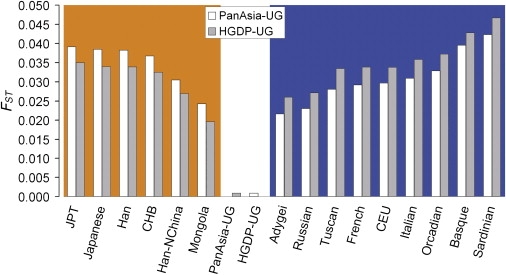
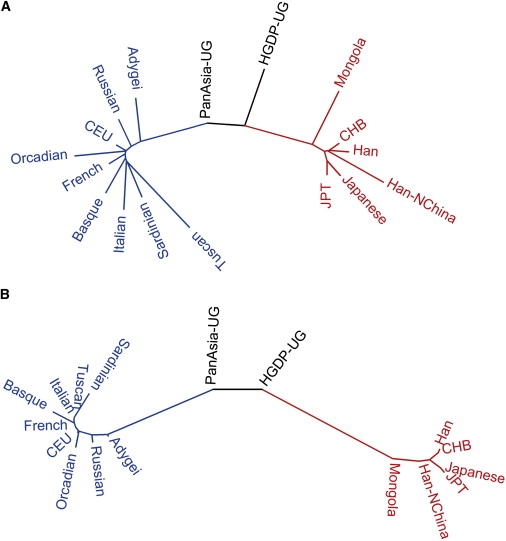
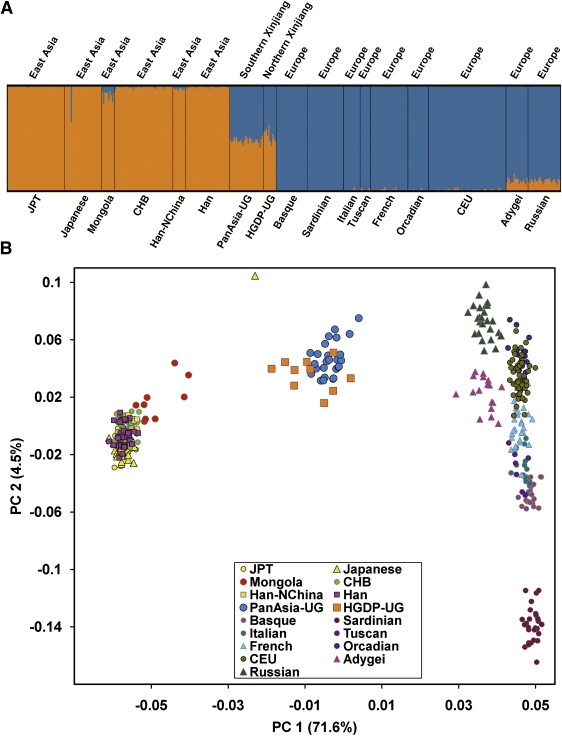
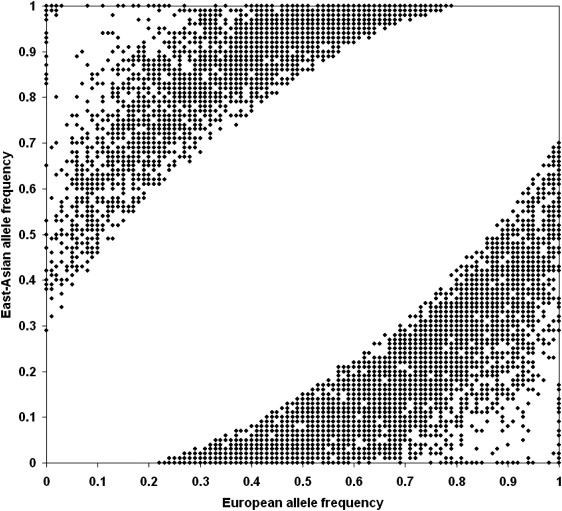
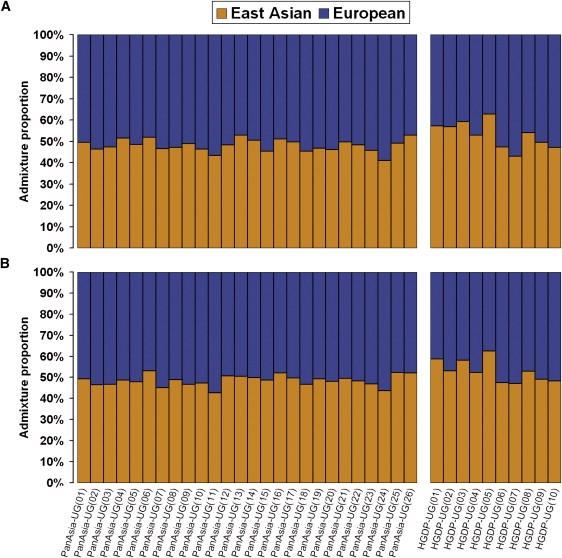
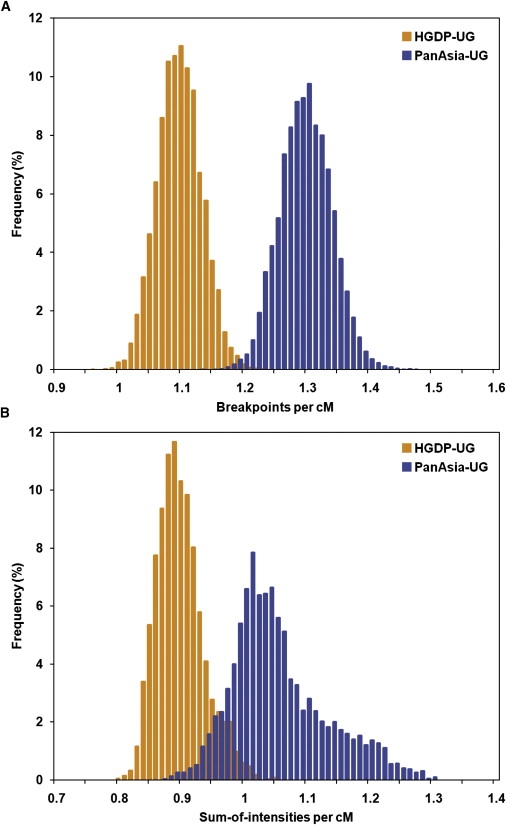
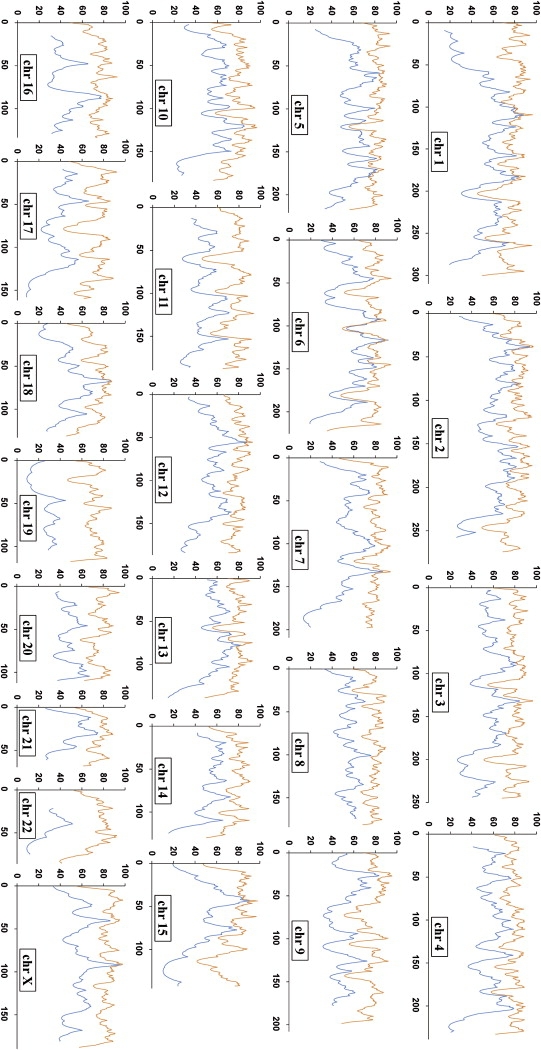
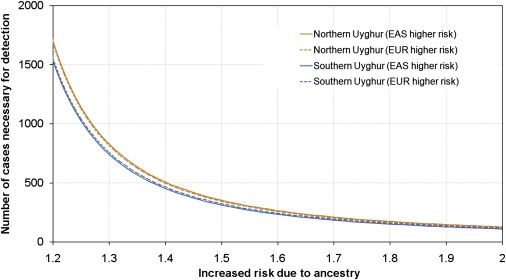
Following up on our previous study, we conducted a genome-wide analysis of admixture for two Uyghur population samples (HGDP-UG and PanAsia-UG), collected from the northern and southern regions of Xinjiang in China, respectively. Both HGDP-UG and PanAsia-UG showed a substantial admixture of East-Asian (EAS) and European (EUR) ancestries, with an empirical estimation of ancestry contribution of 53:47 (EAS:EUR) and 48:52 for HGDP-UG and PanAsia-UG, respectively. The effective admixture time under a model with a single pulse of admixture was estimated as 110 generations and 129 generations, or admixture events occurred about 2200 and 2580 years ago for HGDP-UG and PanAsia-UG, respectively, assuming an average of 20 yr per generation. Despite Uyghurs' earlier history compared to other admixture populations, admixture mapping, holds promise for this population, because of its large size and its mixture of ancestry from different continents. We screened multiple databases and identified a genome-wide single-nucleotide polymorphism panel that can distinguish EAS and EUR ancestry of chromosomal segments in Uyghurs. The panel contains 8150 ancestry-informative markers (AIMs) showing large frequency differences between EAS and EUR populations (F(ST) > 0.25, mean F(ST) = 0.43) but small frequency differences (7999 AIMs validated) within both populations (F(ST) < 0.05, mean F(ST) < 0.01). We evaluated the effectiveness of this admixture map for localizing disease genes in two Uyghur populations. To our knowledge, our map constitutes the first practical resource for admixture mapping in Uyghurs, and it will enable studies of diseases showing differences in genetic risk between EUR and EAS populations.


Figures

Figure 1
Figure 1
Pairwise FST between the Uyghur Population and Other Populations Estimations of FST between Uyghur and East-Asian populations are shaded by orange color and sorted in descending order, and those between Uyghur and European populations are shaded by blue color and sorted in ascending order.
Figure 2
Figure 2
Cluster Relationship of Populations (A) Maximum-likelihood tree of 17 populations. (B) Neighbor-Joining tree of 17 populations based on pair-wise FST. Branches are colored according to ethnic groups; blue is used for European populations, red for East-Asian populations, and black for Uyghur populations.
Figure 3
Figure 3
STRUCTURE Analysis and Principle-Component Analysis for 428 Individuals Representing All 17 Populations (A) Summary plot of individual admixture proportions. The results of individual admixture proportions estimated from 19,934 SNPs. Each individual is represented by a single vertical line broken into two colored segments, with lengths proportional to each of the two inferred clusters; orange indicates East-Asian ancestry proportion and blue indicates European ancestry proportion. The predefined populations IDs are presented at the bottom of the plot, and the geographic region of each population is shown on the top of the plot. (B) Analysis of the first two principal components. Population IDs of individuals are indicated with colors as shown in the legend.
Figure 4
Figure 4
European and East-Asian Allele Frequencies for the 8150 AIMs
Figure 5
Figure 5
Summary Plot of Individual Admixture Proportions Each individual is represented by a single vertical line broken into two colored segments, with lengths proportional to each of the two inferred clusters; orange indicates East-Asian ancestry proportion, and blue indicates European ancestry proportion. The ordinate indicates the proportion unit. The individual IDs are presented at the bottom of the plot. (A) The results of individual admixture proportions estimated from 19,934 SNPs. (B) The results of individual admixture proportions estimated from AIMs.
Figure 6
Figure 6
Posterior Distribution of the Recombination Parameters for HGDP-UG and PANASIA-UG Results estimated from two population samples are indicated with colors as shown in the legend. (A) Posterior distribution of the recombination parameter r (breakpoints per cM) estimated by STRUCTURE analysis. Both the mean and median of r for HGDP-UG are 1.10, and the 90% CI is [1.04, 1.16], and for PanAsia-UG the mean and median are 1.29, and the 90% CI is [1.22, 1.36]. (B) Posterior distribution of the recombination parameter τ (sum of intensities per cM) estimated by ADMIXMAP analysis. Both the mean and median of τ for HGDP-UG are 0.89, and the 90% CI is [0.84, 0.97]; for PanAsia-UG, the mean is 1.05, the median is 1.03, and the 90% CI is [0.94, 1.20].
Figure 7
Figure 7
Distribution of Admixture-Mapping Information for Each Chromosome The admixture-mapping information (ordinate) is shown for each position on the Rutger map (abscissa). The information was determined via the ANCESTRYMAP analysis of genotyping results, with the use of 7999 SNP AIMs for Uyghur (in orange) and 2750 AIMs for PANASIA-UG (in blue).
Figure 8
Figure 8
Sample Size Needed for Detection of a Disease Locus with the use of Admixture Mapping in Uyghur Populations “Northern Uyghurs” refers to the populations represented by HGDP-UG, “Southern Uyghurs” refers to the populations represented by PanAsia-UG. For each population, this quantity is computed under the ideal assumption of perfect information about ancestry, as a function of the relative disease risk conferred by each copy of a particular ancestry at the disease locus.

Comment in

References

    1. Ai Q., Xiao H., Zhao J., Xu Y., Shi F. A survey on physical characteristics of Uigur Nationality. ACTA Anthropologica Sinica. 1993;12:357–365.
    1. Yao Y.G., Kong Q.P., Wang C.Y., Zhu C.L., Zhang Y.P. Different matrilineal contributions to genetic structure of ethnic groups in the silk road region in china. Mol. Biol. Evol. 2004;21:2265–2280. - PubMed
    1. Wells R.S., Yuldasheva N., Ruzibakiev R., Underhill P.A., Evseeva I., Blue-Smith J., Jin L., Su B., Pitchappan R., Shanmugalakshmi S. The Eurasian heartland: a continental perspective on Y-chromosome diversity. Proc. Natl. Acad. Sci. USA. 2001;98:10244–10249. - PMC - PubMed
    1. Xu S., Huang W., Qian J., Jin L. Analysis of genomic admixture in Uyghur and its implication in mapping strategy. Am. J. Hum. Genet. 2008;82:883–894. - PMC - PubMed
    1. Du R. Human Population Genetics Studies in China. Bulletin of Biology. 1997;32:9–12.

Publication types

LinkOut - more resources