. 2008 Nov 7;383(2):437-53.
doi: 10.1016/j.jmb.2008.08.025. Epub 2008 Aug 22.

Folding mechanism of reduced Cytochrome c: equilibrium and kinetic properties in the presence of carbon monoxide

Affiliations

Folding mechanism of reduced Cytochrome c: equilibrium and kinetic properties in the presence of carbon monoxide

Ramil F Latypov et al. J Mol Biol. .

Abstract

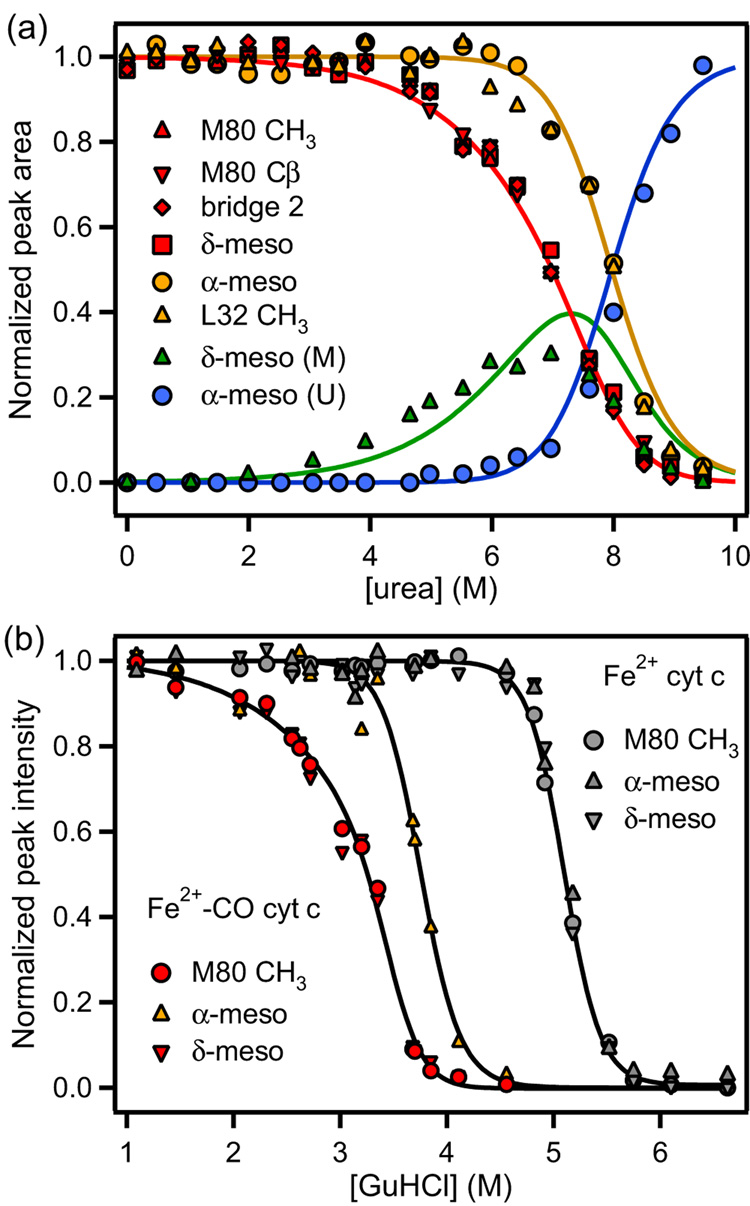
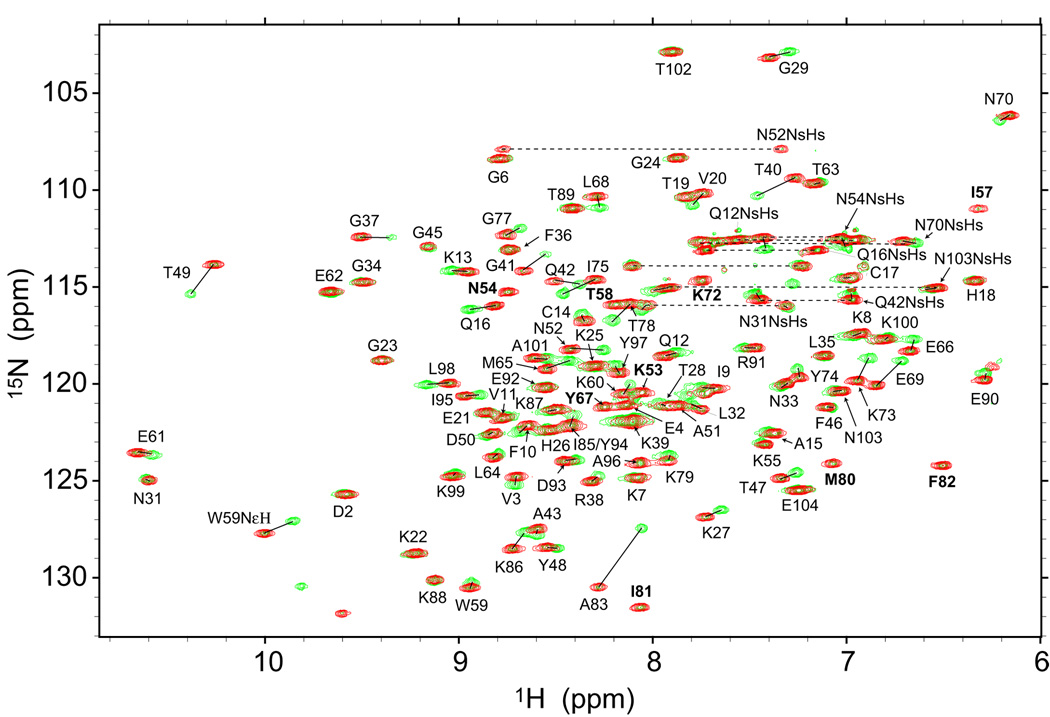
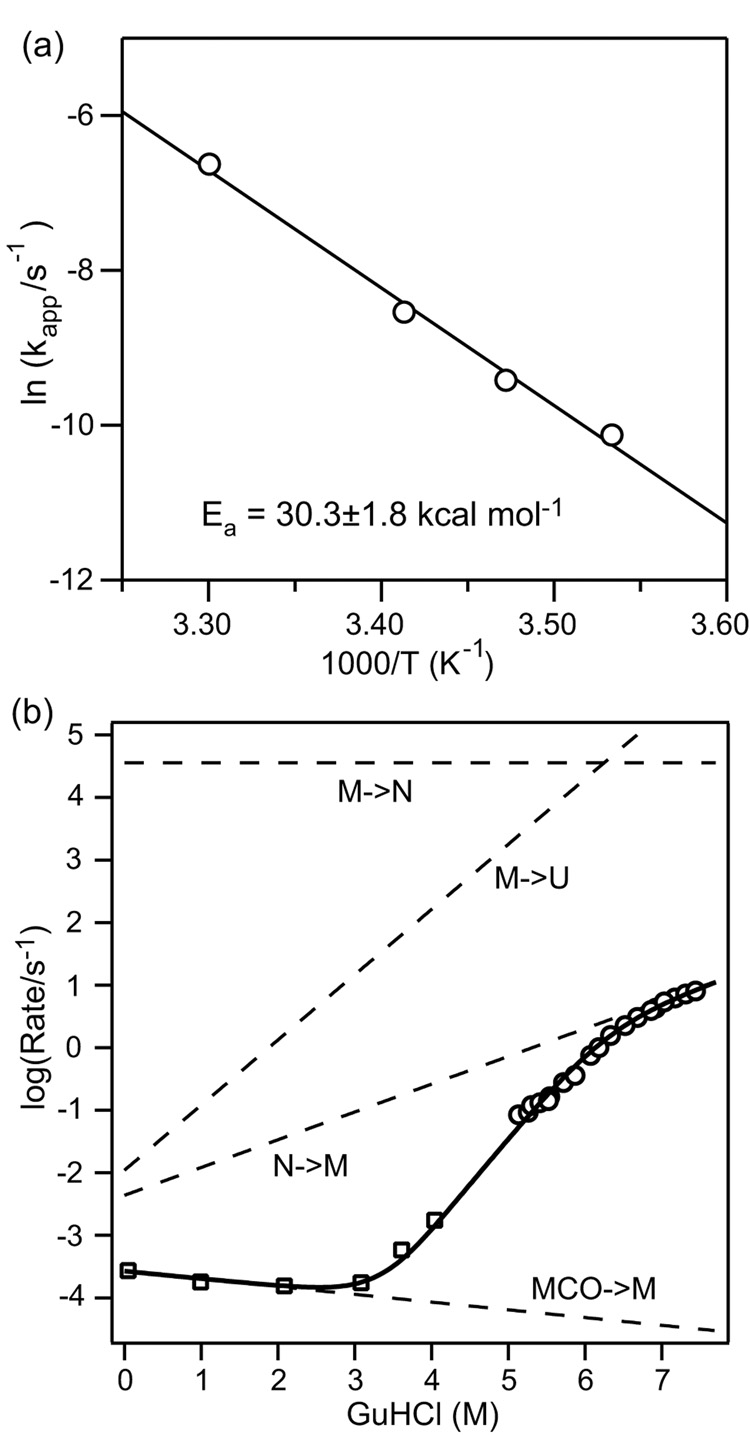
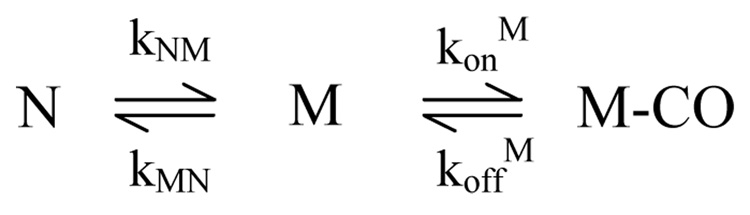
Despite close structural similarity, the ferric and ferrous forms of cytochrome c differ greatly in terms of their ligand binding properties, stability, folding, and dynamics. The reduced heme iron binds diatomic ligands such as CO only under destabilizing conditions that promote weakening or disruption of native methionine-iron linkage. This makes CO a useful conformational probe for detecting partially structured states that cannot be observed in the absence of endogenous ligands. Heme absorbance, circular dichroism, and NMR were used to characterize the denaturant-induced unfolding equilibrium of ferrocytochrome c in the presence and in the absence of CO. In addition to the native state (N), which does not bind CO, and the unfolded CO complex (U-CO), a structurally distinct CO-bound form (M-CO) accumulates to high levels (approximately 75% of the population) at intermediate guanidine HCl concentrations. Comparison of the unfolding transitions for different conformational probes reveals that M-CO is a compact state containing a native-like helical core and regions of local disorder in the segment containing the native Met80 ligand and adjacent loops. Kinetic measurements of CO binding and dissociation under native, partially denaturing, and fully unfolded conditions indicate that a state M that is structurally analogous to M-CO is populated even in the absence of CO. The binding energy of the CO ligand lowers the free energy of this high-energy state to such an extent that it accumulates even under mildly denaturing equilibrium conditions. The thermodynamic and kinetic parameters obtained in this study provide a fully self-consistent description of the linked unfolding/CO binding equilibria of reduced cytochrome c.


Figures

Figure 1
Figure 1
Absorption spectra (Soret and visible regions) of horse Fe2+ cyt c at pH 7.0 (0.1 M sodium phosphate), 20 °C, under native conditions (red; N-state), and under denaturing conditions (6.5 M GuHCl) in the absence (black; U-state) and presence of 1 mM CO (blue; U-CO state). The inset shows an expanded plot of the visible region (470–600 nm).
Figure 2
Figure 2
(a) Absorbance changes at selected wavelengths in the Soret region associated with GuHCl-induced unfolding of Fe2+ cyt c (pH 7.0, 20 °C) in the presence of 1 atm (~1 mM) CO. The lines represent a global fit of a three-state unfolding mechanism (Scheme 1) to the combined absorbance data (transition curves between 380 and 430 nm every 0.5 nm). (b) Intrinsic Soret absorbance spectra of the N-, M-CO and U-CO states obtained by plotting the respective extinction coefficients (local fitting parameters) vs. wavelength.
Figure 3
Figure 3
(a) Normalized changes in ellipticity, θ at 225 nm and heme absorbance at selected wavelengths vs. GuHCl concentration for Fe2+ cyt c (pH 7.0, 20 °C) in the presence of 1 mM CO (green and blue symbols) and absence of ligand (red and yellow symbols). (b) Relative populations of the three states (N: red; M-CO: green; U-CO: blue) populated during unfolding of Fe2+ cyt c in the presence of CO, as predicted by equilibrium parameters in Table 1. The dashed line shows the population of the U-state accumulating during two-state unfolding in the absence of CO.
Figure 4
Figure 4
1D NMR spectra of Fe2+ cyt c (pH 7.0, 22 °C) vs. urea concentration. Expanded plots are shown for the low-field region containing heme meso protons (left) and the high-field region containing methyl and M80 side-chain resonances (right).
Figure 5
Figure 5
(a) Normalized peak intensities of selected resonances resolved by 1D NMR (Figure 4) vs. urea concentration in CO-saturated D2O solution. Red and yellow symbols indicate resolved peaks assigned to the N-state. Green triangles indicate the intensity of the peak at ~9.6 ppm due to the δ-meso proton in the M-state. Blue circles indicate the normalized intensity of the peak at 10.05 ppm assigned to the α-meso proton in the U-state. (b) Normalized peak intensities for the N-state resonances of the M80 methyl and two meso protons vs. GuHCl concentration in the presence of 1 mM CO (colored symbols) and absence of ligand (gray symbols).
Figure 6
Figure 6
15N-1H HSQC spectra of native Fe2+ cyt c (red contours) and its metastable CO complex, M-COms (green) recorded at 15 °C in 0.1 M sodium phosphate, pH 7.0. Cross peaks labeled in bold undergo especially large CO-induced chemical shift changes and can be assigned only in the unligated form.
Figure 7
Figure 7
(a) Chemical shift changes associated with dissociation of the CO-ligand from M-COms vs. residue number. 1H/15N chemical shift changes were scaled as follows: Δδ(1H, 15N) = sqrt[Δδ (1H)2 + (Δδ(15N)/10)2], where Δδ(1H) is the CO-induced change in the NH proton chemical shift and Δδ(15N) the corresponding change in the 15N chemical shift. (b) Ribbon diagram of cyt c (pdb: 1hrc) indicating regions of cyt c undergoing structural changes upon binding of a CO ligand under native conditions. Side chains shown in ball-and-stick mode indicate residues undergoing large chemical shift changes (Δδ > 0.4 ppm; red) and intermediate changes (0.15 ppm ≤ Δδ ≤0.4 ppm; green).
Figure 8
Figure 8
(a) Absorbance spectra of Fe2+ cyt c in the Soret region as a function of total CO concentration ranging from 0 nM to 50 µM under unfolding conditions at 20 °C. The CO concentrations are color-coded as shown in the legend. The buffer contained 0.1 M Tris-HCl (pH 7.5), 6.5 M GuHCl, 3 mM dithionite. (b) CO binding curve (circles) monitored by absorbance at 413 nm as a function of total CO concentration. The solid line is a theoretical binding curve obtained by fitting the data based on Eq. 2.
Figure 9
Figure 9
(a) Rate constant of CO rebinding to unfolded Fe2+ cyt c (in 6 M GuHCl, 0.1 M sodium phosphate, pH 7.0) vs. CO concentration measured at 10 °C by laser flash photolysis (see text). (b) Arrhenius plot of the rate of CO recombination to unfolded Fe2+ cyt c measured by laser flash photolysis at variable temperature (5–30 °C) and a constant CO concentration of 135 µM. (c) Rate constant for heme absorbance changes upon addition of imidazole to CO-bound Fe2+ cyt c (in 6.4 M GuHCl, 0.1 M Tris-HCl, pH 8.0) vs. total imidazole concentration. The limiting value reached at high imidazole concentration represents the rate of CO dissociation.
Figure 10
Figure 10
(a) Arrhenius plot of the apparent rate of CO binding to Fe2+ cyt c at 2.5 M GuHCl (0.1 M sodium phosphate, pH 7.0, 1 mM CO) measured by manual mixing. (b) Logarithmic plot of the rate constant of thermally activated CO dissociation from the metastable CO complex (M-COms) vs. GuHCl concentration (open squares). Also shown are the rate constants of unfolding of Fe2+ cyt c in the absence of CO (open circles) measured by absorbance-detected stopped-flow unfolding measurements at high GuHCl concentrations. The solid line represents the observable rate constant for the coupled CO-binding/unfolding process predicted on the basis of Scheme 2. The dashed lines indicate the elementary rate constants used for kinetic modeling.
Figure 11
Figure 11
Schematic free-energy diagrams for Fe2+ cyt c in the absence (black lines) and presence of CO (red lines) under native conditions (left panel) and moderately denaturing conditions (right panel). The free energies of the various states and relative barrier heights are consistent with the equilibrium and kinetic parameters in Table 3, respectively.
Scheme 1
Scheme 1
Scheme 2
Scheme 2
Scheme 3
Scheme 3

References

    1. Lecomte JT, Sukits SF, Bhattacharya S, Falzone CJ. Conformational properties of native sperm whale apomyoglobin in solution. Protein Sci. 1999;8:1484–1491. - PMC - PubMed
    1. Feng YQ, Wand AJ, Sligar SG. 1H and 15N NMR resonance assignments and preliminary structural characterization of Escherichia coli apocytochrome b562. Biochemistry. 1991;30:7711–7717. - PubMed
    1. Stellwagen E, Rysavy R, Babul G. The conformation of horse heart apocytochrome c. J. Biol. Chem. 1972;247:8074–8077. - PubMed
    1. Fisher WR, Taniuchi H, Anfinsen CB. On the role of heme in the formation of the structure of cytochrome c. J. Biol. Chem. 1973;248:3188–3195. - PubMed
    1. Dumont ME, Cardillo TS, Hayes MK, Sherman F. Role of cytochrome c heme lyase in mitochondrial import and accumulation of cytochrome c in Saccharomyces cerevisiae. Molec. Cell Biol. 1991;11:5487–5496. - PMC - PubMed

Publication types

LinkOut - more resources