. 2008 Dec;43(4):721-30.
doi: 10.1016/j.neuroimage.2008.07.060. Epub 2008 Aug 13.

Infant brain probability templates for MRI segmentation and normalization

Affiliations

Infant brain probability templates for MRI segmentation and normalization

Mekibib Altaye et al. Neuroimage. 2008 Dec.

Abstract

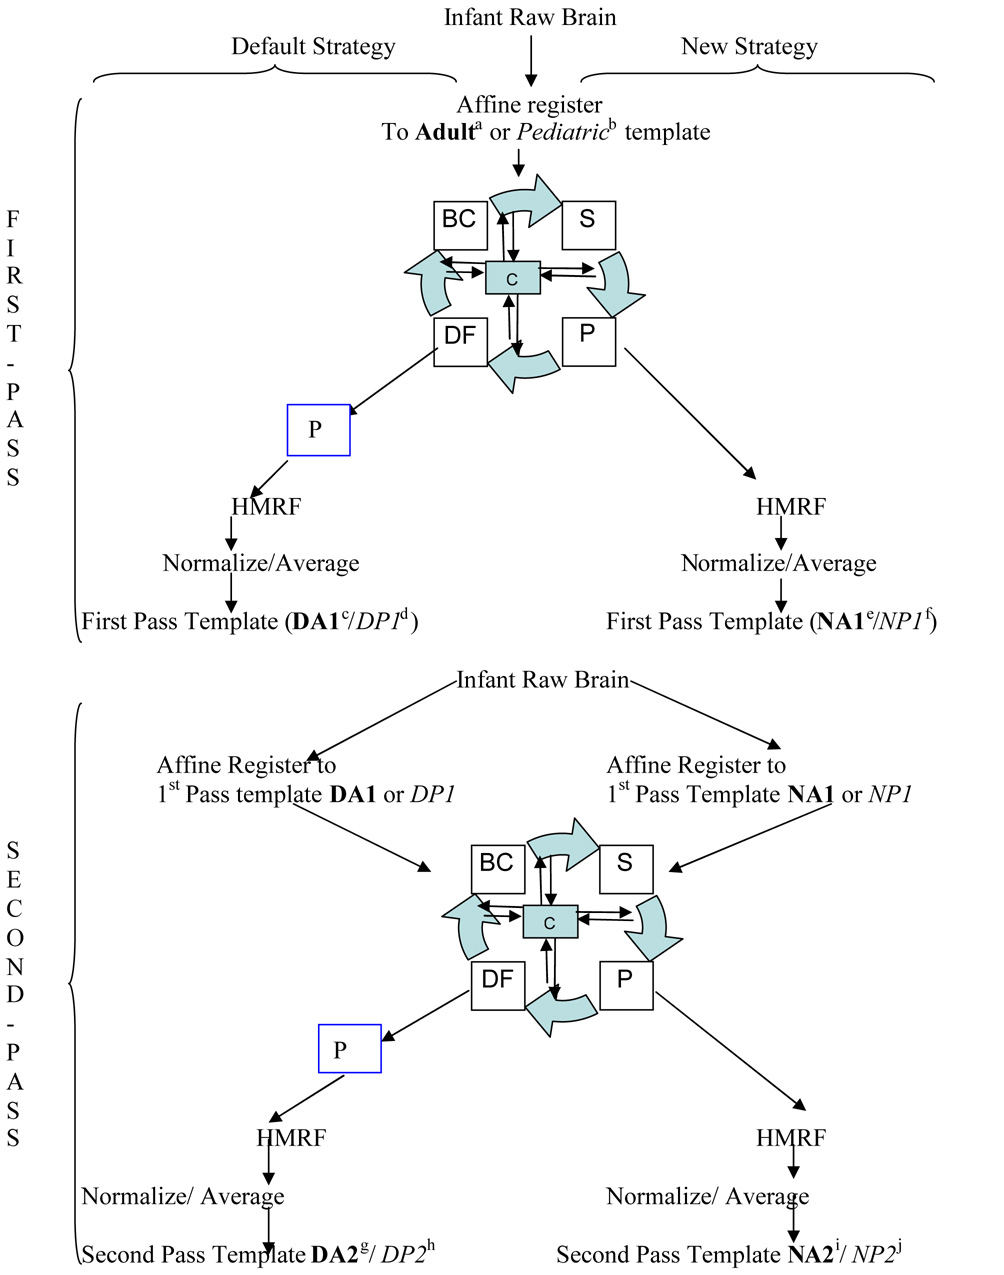
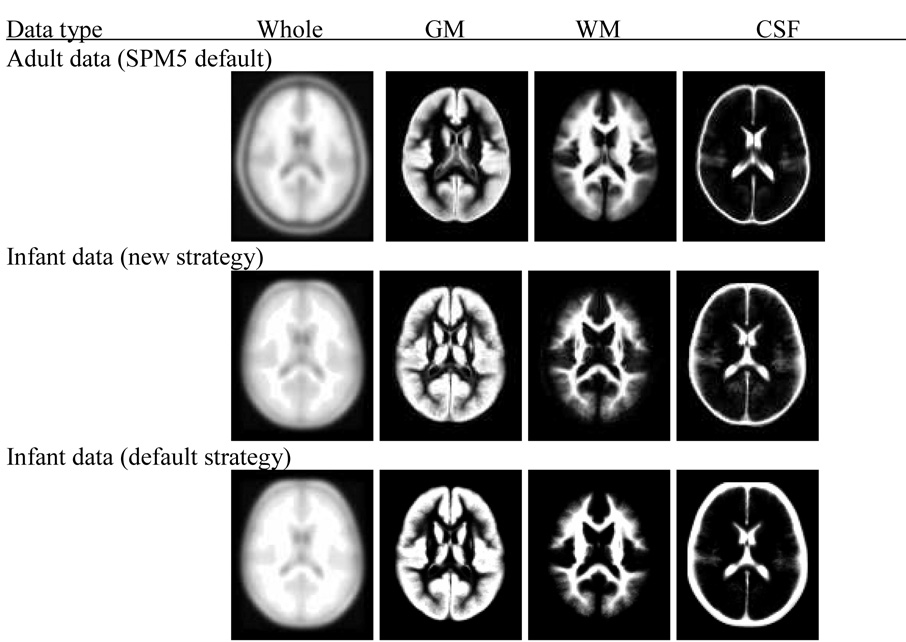
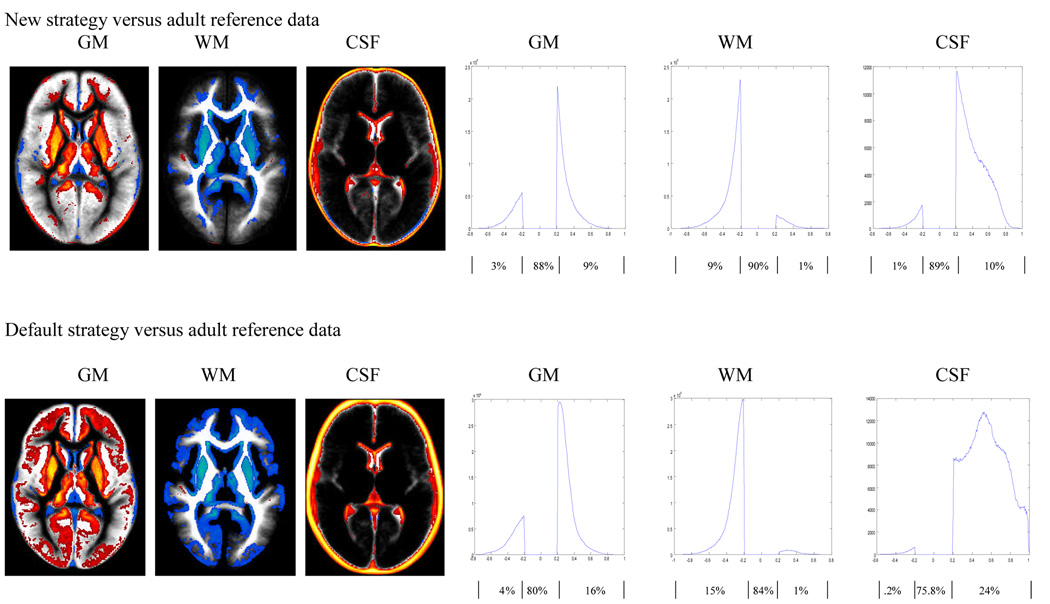
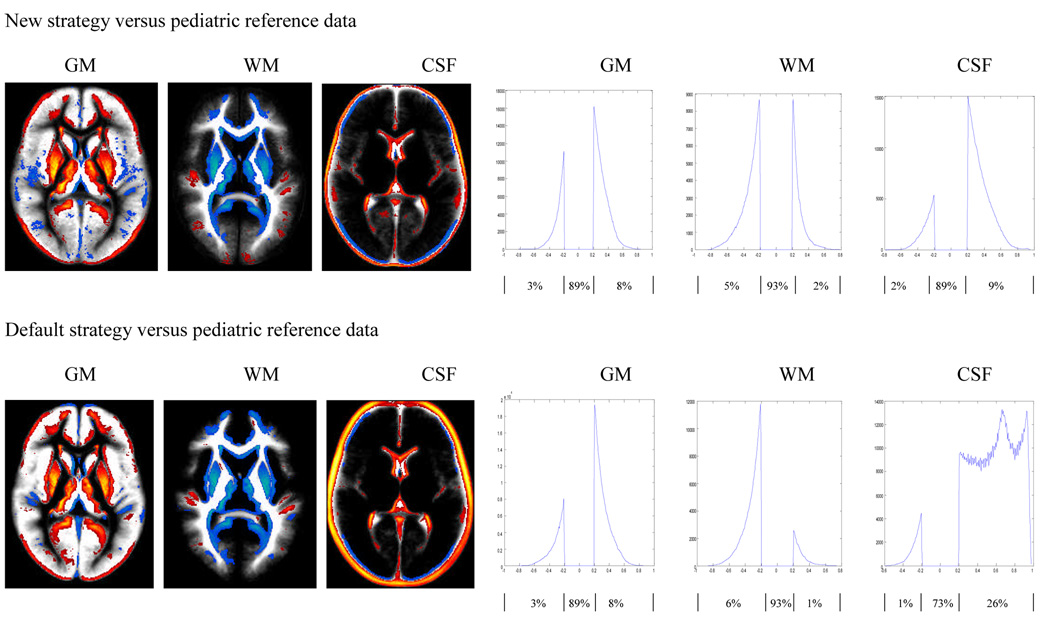
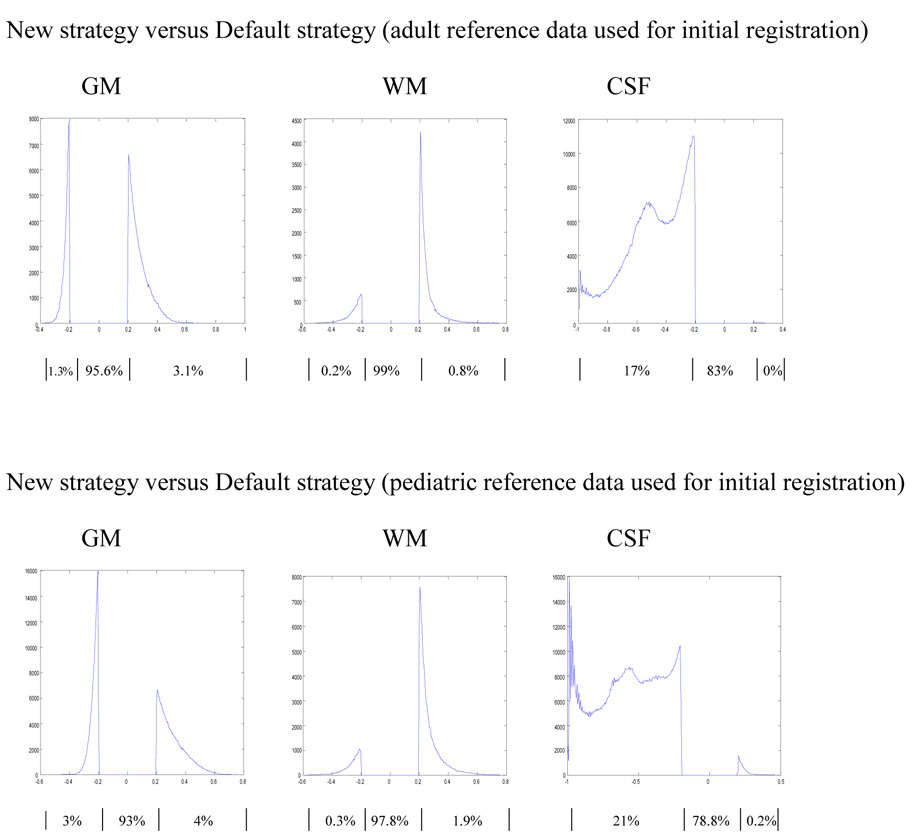
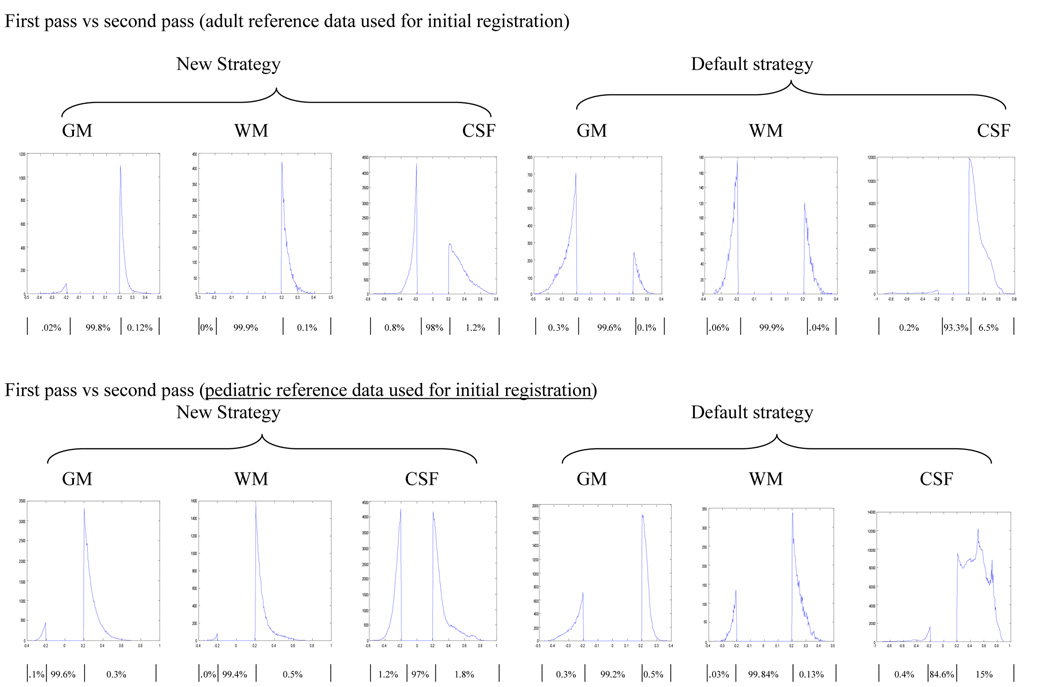
Spatial normalization and segmentation of infant brain MRI data based on adult or pediatric reference data may not be appropriate due to the developmental differences between the infant input data and the reference data. In this study we have constructed infant templates and a priori brain tissue probability maps based on the MR brain image data from 76 infants ranging in age from 9 to 15 months. We employed two processing strategies to construct the infant template and a priori data: one processed with and one without using a priori data in the segmentation step. Using the templates we constructed, comparisons between the adult templates and the new infant templates are presented. Tissue distribution differences are apparent between the infant and adult template, particularly in the gray matter (GM) maps. The infant a priori information classifies brain tissue as GM with higher probability than adult data, at the cost of white matter (WM), which presents with lower probability when compared to adult data. The differences are more pronounced in the frontal regions and in the cingulate gyrus. Similar differences are also observed when the infant data is compared to a pediatric (age 5 to 18) template. The two-pass segmentation approach taken here for infant T1W brain images has provided high quality tissue probability maps for GM, WM, and CSF, in infant brain images. These templates may be used as prior probability distributions for segmentation and normalization; a key to improving the accuracy of these procedures in special populations.


Figures

Figure 1
Figure 1
Overview of infant template construction. Initially all images are registered to the adult /pediatric template. After registration a segmentation estimation procedure is used to estimate the parameters by iteratively going through segmentation (S), bias correction (BC), deformation (DF) and priors (P) until convergence criteria (C) are met. After this step two strategies are used for calculation of the tissue probability maps. The first (default) strategy includes adult prior probabilities for distribution of GM, WM and CSF based on adult / pediatric data indicated by the inclusion of the blue box (P). The second (new) strategy does not use prior probability distributions in the calculation of the tissue probability maps; instead it only uses the intensity of the T1 images. Then a Hidden Markov Random Field (HMRF) process is applied to the resulting image, normalized and averaged to produce the first pass template. Second pass templates are obtained in similar fashion except the first pass template is used for registration and normalization. Key: DA1/DP1=First pass adult/pediatric template via default strategy; DA2/DP2=Second pass adult/pediatric template via default strategy; NA1/NP1=First pass adult/ pediatric template via new strategy; NA2/NP2=Second pass adult/pediatric template via new strategy. Bold font indicates adult data while italic font indicates pediatric data. Comparisons: 1. (g-a) and (i-a); 2. (h-b) and (j-b); 3. (g-i); 4. (g-c), (i-e) and (h-d), (j-f); using number conventions from table 2.
Figure 2
Figure 2
Display of adult reference data and infant templates including GM, WM and CSF probability maps. The top panel is for the adult data (SPM 5 default), the middle panel is for infant data processed using the new strategy and the bottom panel is for infant data processed using the default strategy as outlined in Figure 1. The displayed infant data is based on second pass output.
Figure 3
Figure 3
Comparison of adult a priori data and infant GM, WM and CSF distributions constructed using the new (top panel) and default (bottom panel) strategies as outlined in Figure 1. Differences are displayed as an overlay on the infant data to show spatial location (left panels, where red and yellow indicates infant probability is greater than adult probability while blue is for the reverse effect), and as a histogram to show their distribution (right panels). Results shown are for differences of at least 20% in tissue probability and are based on the second pass output. For the histograms, the x-axis represents the magnitude of differences and the y-axis the corresponding number of voxels. The flat line between −0.2 and 0.2 indicates the 20% threshold used, while the curves on the right and left indicate where the infant tissue probability is greater or less than the adult data respectively. Percentages of voxels in each segment of the histogram (i.e. <−0.2, no difference, >0.2) are listed below the horizontal axis.
Figure 4
Figure 4
Comparison of pediatric a priori data versus infant GM, WM and CSF distributions constructed using new (top panel) and default (bottom panel) strategies as outlined in Figure 1. Differences are displayed as an overlay on the infant data to show spatial location (left panels, where red and yellow indicates infant probability is greater than adult probability while blue is for the reverse effect), and as a histogram to show their distribution (right panels). Results shown are for differences of at least 20% in tissue probability and are based on the second pass output. For the histograms, the x-axis represents the magnitude of differences and the y-axis the corresponding number of voxels. The flat line between −0.2 and 0.2 indicates the 20% threshold used, while the curves on the right and left indicate where the infant tissue probability is greater or less than the pediatric data respectively. Percentages of voxels in each segment of the histogram (i.e. <−0.2, no difference, >0.2) are listed below the horizontal axis.
Figure 5
Figure 5
Comparison of GM, WM and CSF probability distributions in second pass infant data obtained with the new and default strategy. In the top panel adult and in the bottom pediatric reference data were used for initial registration. The histograms indicate the distribution of the differences for each tissue class. Results shown are for differences of at least 20% in tissue probability. For the histograms, the x-axis represents the magnitude of differences and the y-axis the corresponding number of voxels. The flat line between −0.2 and 0.2 indicates the 20% threshold used, while the curves on the right and left indicate where the infant tissue probability obtained using the new strategy is greater or less than the infant data obtained using the default strategy respectively. Percentages of voxels in each segment of the histogram (i.e. <−0.2, no difference, >0.2) are listed below the horizontal axis.
Figure 6
Figure 6
Comparison of first pass and second pass probability maps for images prepared using the new (top panel) and default (bottom panel) strategies. The histograms show the distribution of these differences for each tissue class and strategy. Results shown are for differences of at least 20% in tissue probability. The x-axis represents the magnitude of differences and the y-axis the corresponding number of voxels The flat line between −0.2 and 0.2 indicates the 20% threshold used, while the curves on the right and left indicate where the infant tissue probability obtained using the second pass approach is greater or less than the infant data obtained from the first pass approach respectively. Percentages of voxels in each segment of the histogram (i.e. <−0.2, no difference, >0.2) are listed below the horizontal axis

References

    1. Ashburner J, Friston KJ. Unified segmentation. NeuroImage. 2005;26:839–851. - PubMed
    1. Burgund ED, Kang HC, Kelly JE, Buckner RL, Snyder AZ, Petersen SE, Schlaggar BL. The feasibility of a common stereotactic space for children and adults in fMRI studies of development. NeuroImage. 2002;17:184–200. - PubMed
    1. Cuadra MB, Cammoun L, Butz T, Cuisenaire O, Thiran JP. Comparison and validation of tissue modelization and statistical classification methods in T1-weighted MR brain images. IEEE Trans Med Imaging. 2005;24:1548–1565. - PubMed
    1. Dehaene-Lambertz G, Dehaene S, Hertz-Pannier L. Functional neuroimaging of speech perception in infants. Science. 2002;298:2013–2015. - PubMed
    1. Evans AC, Collins DL, Mills SR, Brown ED, Kelly RL, Peters TM. 3D statistical neuroanatomical models from 305 MRI volumes. Proc. IEEE-Nucl Sci Symp Med Imaging Conf. 1993:1813–1817.

Publication types

MeSH terms