

Ectopic expression of Arabidopsis thaliana plasma membrane intrinsic protein 2 aquaporins in lily pollen increases the plasma membrane water permeability of grain but not of tube protoplasts
- PMID: 18761636
- PMCID: PMC2999827
- DOI: 10.1111/j.1469-8137.2008.02607.x
Ectopic expression of Arabidopsis thaliana plasma membrane intrinsic protein 2 aquaporins in lily pollen increases the plasma membrane water permeability of grain but not of tube protoplasts
Abstract
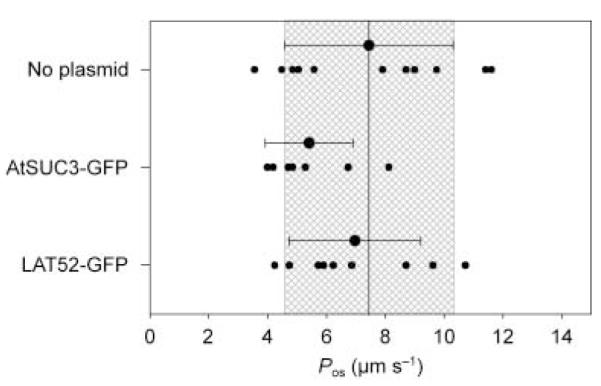
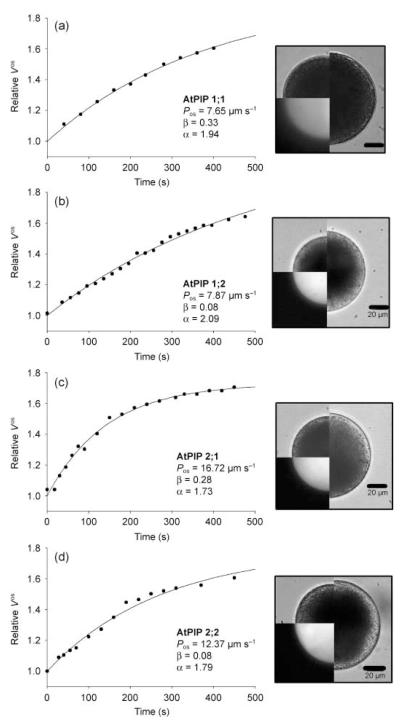
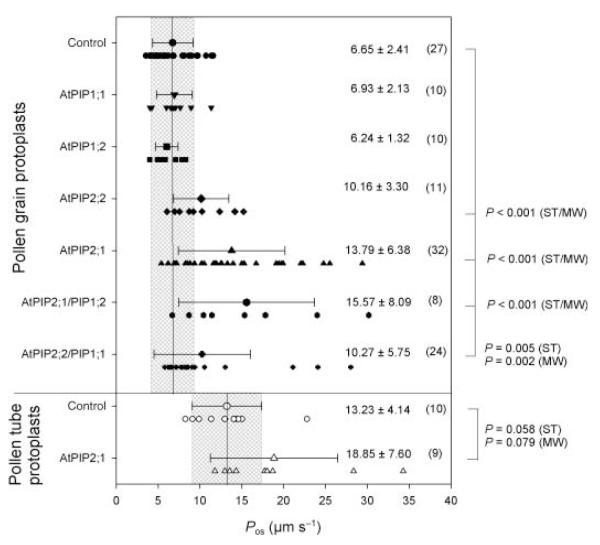
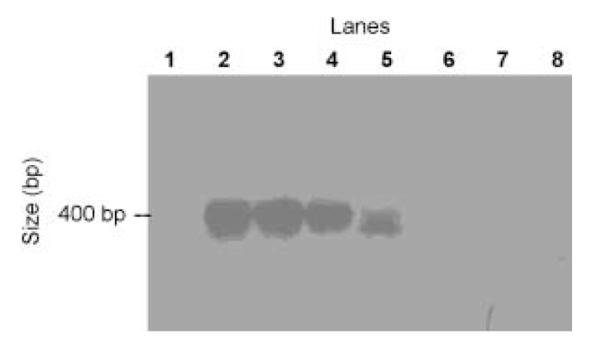
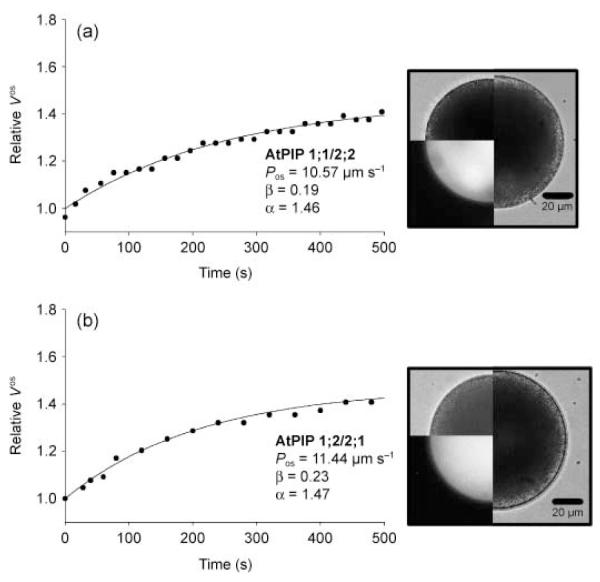
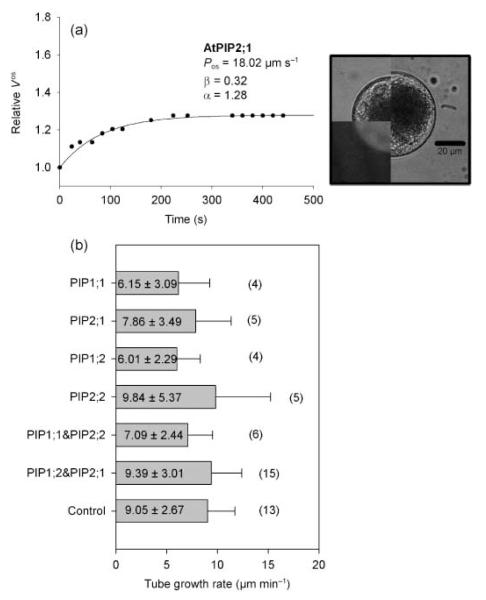
To investigate the role of aquaporin-mediated water transport during pollen grain germination and tube growth, Arabidopsis thaliana plasma membrane intrinsic proteins (PIPs) were expressed in pollen of Lilium longiflorum (lily). Successful expression of AtPIPs in particle-bombarded lily pollen grains was monitored by co-expression with fluorescent proteins and single-cell RT-PCR, and by measuring the water permeability coefficient (P(os)) in swelling assays using protoplasts prepared from transformed pollen grains and tubes. Expression of AtPIP1;1 and AtPIP1;2 in pollen grains resulted in P(os) values similar to those measured in nontransformed pollen grain protoplasts (6.65 +/- 2.41 microm s(-1)), whereas expression of AtPIP2 significantly increased P(os) (AtPIP2;1, 13.79 +/- 6.38; AtPIP2;2, 10.16 +/- 3.30 microm s(-1)). Transformation with combinations of AtPIP1 and AtPIP2 did not further enhance P(os). Native pollen tube protoplasts showed higher P(os) values (13.23 +/- 4.14 microm s(-1)) than pollen grain protoplasts but expression of AtPIP2;1 (18.85 +/- 7.60 microm s(-1)) did not significantly increase their P(os) values. Expression of none of the tested PIPs had any effect on pollen tube growth rates. The ectopic expression of AtPIP2s in lily pollen increased the water permeability of the plasma membrane in pollen grains, but not in pollen tubes. The measured endogenous water permeability does not limit water uptake during tube growth, but has to be regulated to prevent tube bursting.
Figures
Similar articles
-
Measuring the osmotic water permeability of the plant protoplast plasma membrane: implication of the nonosmotic volume.J Membr Biol. 2007 Feb;215(2-3):111-23. doi: 10.1007/s00232-007-9011-6. Epub 2007 Jun 14. J Membr Biol. 2007. PMID: 17568979 Free PMC article.
-
[Membrane potential changes during pollen germination and tube growth].Tsitologiia. 2009;51(10):815-23. Tsitologiia. 2009. PMID: 19950860 Russian.
-
Hydrogen peroxide permeability of plasma membrane aquaporins of Arabidopsis thaliana.J Plant Res. 2012 Jan;125(1):147-53. doi: 10.1007/s10265-011-0413-2. Epub 2011 Mar 10. J Plant Res. 2012. PMID: 21390558
-
Hydrogen peroxide affects ion channels in lily pollen grain protoplasts.Plant Biol (Stuttg). 2016 Sep;18(5):761-7. doi: 10.1111/plb.12470. Epub 2016 May 18. Plant Biol (Stuttg). 2016. PMID: 27115728
-
Pollen tube growth and guidance: roles of small, secreted proteins.Ann Bot. 2011 Sep;108(4):627-36. doi: 10.1093/aob/mcr015. Epub 2011 Feb 8. Ann Bot. 2011. PMID: 21307038 Free PMC article. Review.
Cited by
-
Lost in traffic? The K(+) channel of lily pollen, LilKT1, is detected at the endomembranes inside yeast cells, tobacco leaves, and lily pollen.Front Plant Sci. 2015 Feb 10;6:47. doi: 10.3389/fpls.2015.00047. eCollection 2015. Front Plant Sci. 2015. PMID: 25713578 Free PMC article.
-
An osmotic model of the growing pollen tube.PLoS One. 2012;7(5):e36585. doi: 10.1371/journal.pone.0036585. Epub 2012 May 16. PLoS One. 2012. PMID: 22615784 Free PMC article.
-
Mercury-sensitive water channels as possible sensors of water potentials in pollen.J Exp Bot. 2013 Nov;64(16):5195-205. doi: 10.1093/jxb/ert311. Epub 2013 Oct 5. J Exp Bot. 2013. PMID: 24098048 Free PMC article.
-
Signaling with Ions: The Keystone for Apical Cell Growth and Morphogenesis in Pollen Tubes.Plant Physiol. 2017 Jan;173(1):91-111. doi: 10.1104/pp.16.01561. Epub 2016 Nov 28. Plant Physiol. 2017. PMID: 27895207 Free PMC article. Review.
-
Transcriptome and Small RNA Sequencing Reveal the Mechanisms Regulating Harvest Index in Brassica napus.Front Plant Sci. 2022 Apr 4;13:855486. doi: 10.3389/fpls.2022.855486. eCollection 2022. Front Plant Sci. 2022. PMID: 35444672 Free PMC article.
References
-
- Benkert R, Obermeyer G, Bentrup F-W. The turgor pressure of growing lily pollen tubes. Protoplasma. 1997;198:1–8.
-
- Biela A, Grote K, Otto B, Hoth S, Hedrich R, Kaldenhoff R. The Nicotiana tabacum plasma membrane NtAQP1 is mercury-insensitive and permeable for glycerol. Plant Journal. 1999;18:565–570. - PubMed
-
- Bots M, Feron R, Uehlein N, Weterings K, Kaldenhoff R, Mariani C. PIP1 and PIP2 aquaporins are differentially expressed during tobacco anther and stigma development. Journal of Experimental Botany. 2005;56:113–121. - PubMed
Publication types
MeSH terms
Substances
Grants and funding
LinkOut - more resources
Full Text Sources
Molecular Biology Databases
