Review
. 2008 Sep;8(3):186-200.
doi: 10.1016/j.cmet.2008.08.006.

The emerging genetic architecture of type 2 diabetes

Affiliations
Review

The emerging genetic architecture of type 2 diabetes

Alessandro Doria et al. Cell Metab. 2008 Sep.

Abstract

Type 2 diabetes is a genetically heterogeneous disease, with several relatively rare monogenic forms and a number of more common forms resulting from a complex interaction of genetic and environmental factors. Previous studies using a candidate gene approach, family linkage studies, and gene expression profiling uncovered a number of type 2 genes, but the genetic basis of common type 2 diabetes remained unknown. Recently, a new window has opened on defining potential type 2 diabetes genes through genome-wide SNP association studies of very large populations of individuals with diabetes. This review explores the pathway leading to discovery of these genetic effects, the impact of these genetic loci on diabetes risk, the potential mechanisms of action of the genes to alter glucose homeostasis, and the limitations of these studies in defining the role of genetics in this important disease.


Figures

Figure 1
Figure 1. Complex Pathogenesis of Type 2 Diabetes
Genetic and environemntal factors may influence the risk of diabetes through the pathways ilustrated in the figure or through as-yet-unidentifed mechanisms affecting insulin sensitivity and/or insulin secretion.
Figure 2
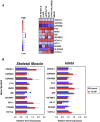
Figure 2. Expression Profiles of Genes Placed at the Type 2 Diabetes Loci Identified to Date
(A) Expression levels across different tissues. (B) Relative expression levels in skeletal muscle and pancreatic islets from diabetic and nondiabetic subjects. Skeletal muscle expression data were derived from a cohort of metabolically characterized Mexican-American subjects with established DM2, treated with sulfonylureas or lifestyle only (n = 5), and compared with control individuals with normal glucose tolerance (n = 6) (Patti et al., 2003). The data on pancreatic islets were derived from isolated islets purified from five type 2 diabetic subjects and seven normoglycemic controls (Gunton et al., 2005). The mean duration of type 2 diabetes was 5.8 ± 2.1 years, and no subjects were insulin requiring. Mean HbA1c was 7.5 ± 0.5% in the diabetic subjects. RNA was extracted from at least 1000 islet equivalents per subject. RNA was prepared separately for each subject and hybridized to Affymetrix U133A and B microarrays. For each study, cRNA was prepared separately for each subject and hybridized to Affymetrix HuGene FL (muscle) and U133A and B (islet) microarrays. Complete microarray data sets are available on the Diabetes Genome Anatomy Project (DGAP) website (http://www.diabetesgenome.org).
Figure 3
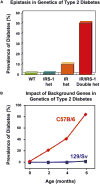
Figure 3. Gene-Gene Interaction in the Etiology of Type 2 Diabetes as Exemplified by Animal Models
(A) Epistasis between insulin receptor (IR) and insulin receptor substrate 1 (IRS1) gene targeting in the development of type 2 diabetes. (B) Impact of genetic background on the development of type 2 diabetes in mice with genetic insulin resistance.
Figure 4
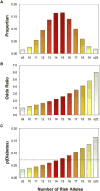
Figure 4. Predictive Value of Multiple Genetic Markers for Type 2 Diabetes
(A) Number of risk alleles carried by individuals from the general population at the 15 type 2 diabetes loci identified to date. Estimates are based on the risk allele frequencies reported in Table 3 and assume independent segregation of the 15 loci. (B) Odds ratios of type 2 diabetes as a function of the number of risk alleles. The average OR associated with each number of allele was estimated under the assumption of a multiplicative (log-additive) model on the basis of the individual ORs listed in Table 3 and the relative frequencies of the risk alleles in each class. (C) Probability of type 2 diabetes as a function of the number of risk alleles. Estimates assume an average (pretest) probability of type 2 diabetes of 0.07 (indicated by the dashed line).

Similar articles

Cited by

References

    1. Almind K, Inoue G, Pedersen O, Kahn CR. A common amino acid polymorphism in insulin receptor substrate-1 causes impaired insulin signaling. Evidence from transfection studies. J Clin Invest. 1996;97:2569–2575. - PMC - PubMed
    1. Almind K, Delahaye L, Hansen T, Van Obberghen E, Pedersen O, Kahn CR. Characterization of the Met326Ile variant of phosphatidylinositol 3-kinase p85alpha. Proc Natl Acad Sci USA. 2002;99:2124–2128. - PMC - PubMed
    1. Almind K, Kulkarni RN, Lannon SM, Kahn CR. Identification of Interactive Loci Linked to Insulin and Leptin in Mice With Genetic Insulin Resistance. Diabetes. 2003;52:1535–1543. - PubMed
    1. Altshuler D, Hirschhorn JN, Klannemark M, Lindgren CM, Vohl MC, Nemesh J, Lane CR, Schaffner SF, Bolk S, Brewer C, et al. The common PPARgamma Pro12Ala is associated with decreased risk of type 2 diabetes. Nat Genet. 2000;26:76–80. - PubMed
    1. Barroso I, Gurnell M, Crowley VE, Agostini M, Schwabe JW, Soos MA, Maslen GL, Williams TD, Lewis H, Schafer AJ, et al. Dominant negative mutations in human PPARgamma associated with severe insulin resistance, diabetes mellitus and hypertension. Nature. 1999;402:880–883. - PubMed

Publication types