. 2008 Jul;78(1 Pt 1):011910.
doi: 10.1103/PhysRevE.78.011910. Epub 2008 Jul 21.

Information capacity of genetic regulatory elements

Affiliations

Information capacity of genetic regulatory elements

Gasper Tkacik et al. Phys Rev E Stat Nonlin Soft Matter Phys. 2008 Jul.

Abstract

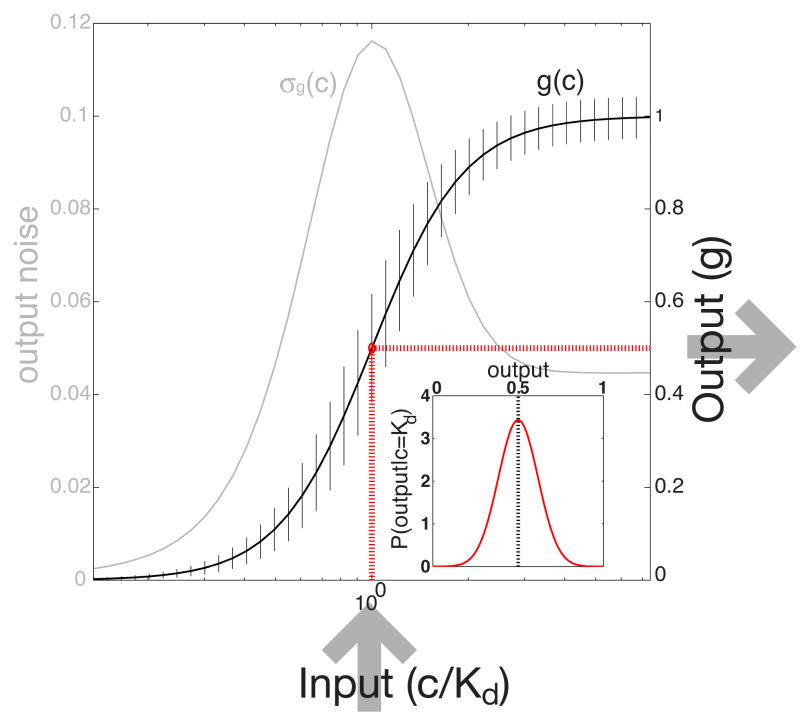
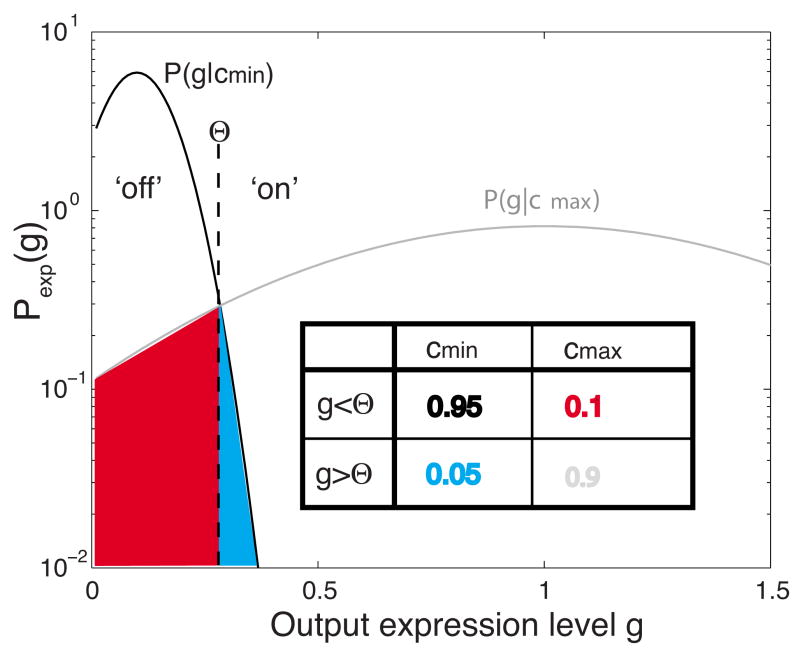
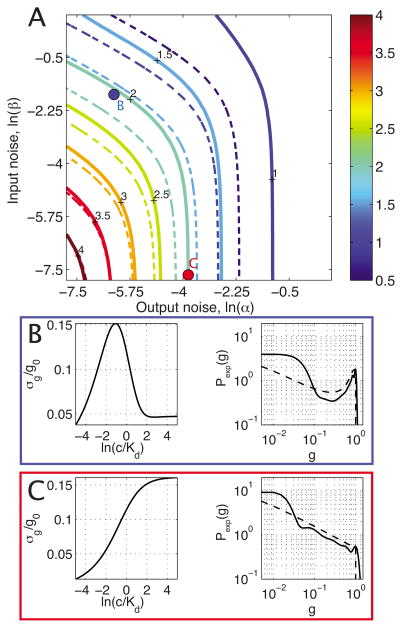
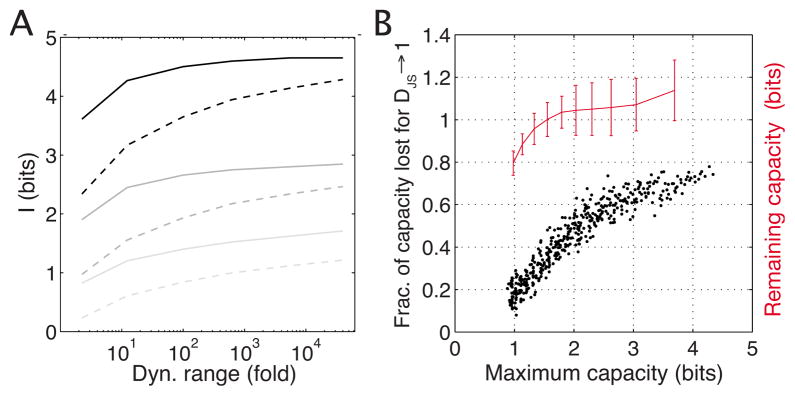
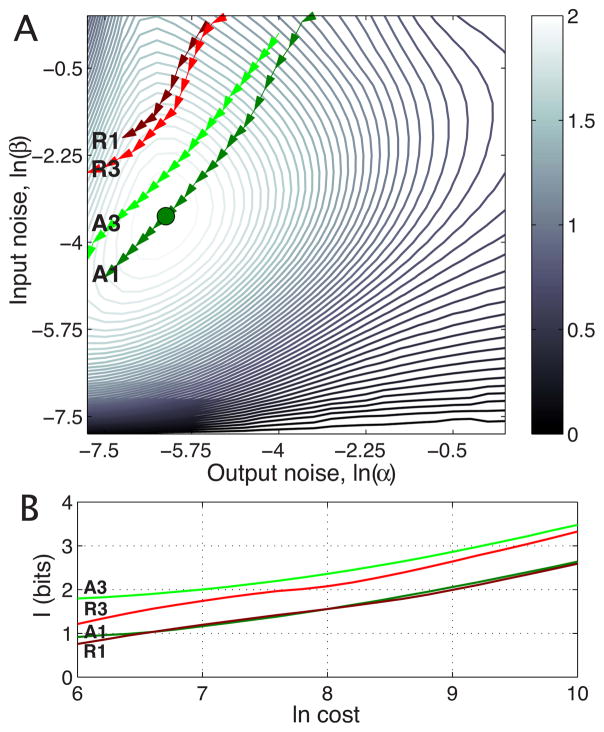
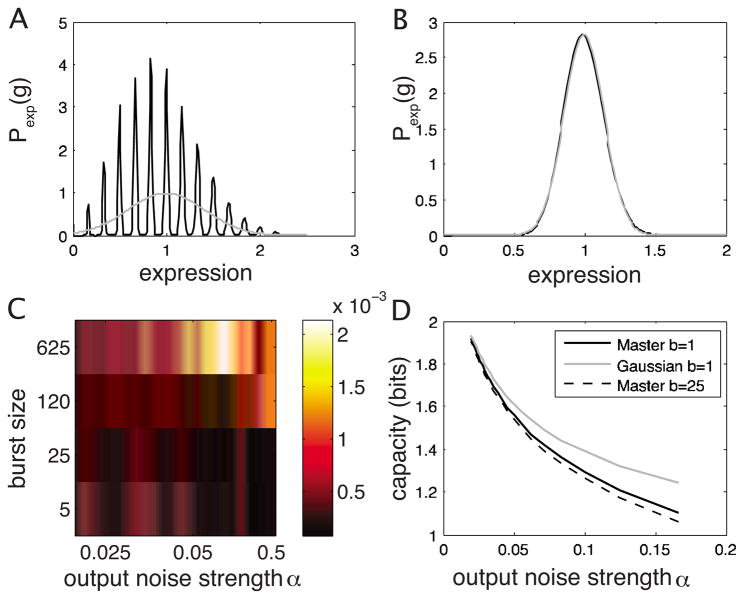
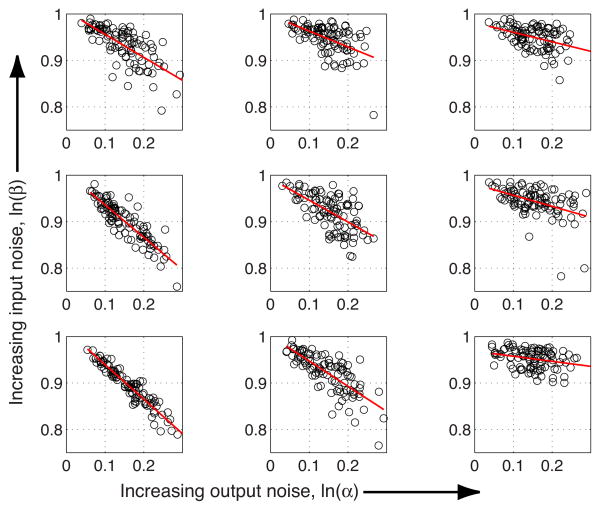
Changes in a cell's external or internal conditions are usually reflected in the concentrations of the relevant transcription factors. These proteins in turn modulate the expression levels of the genes under their control and sometimes need to perform nontrivial computations that integrate several inputs and affect multiple genes. At the same time, the activities of the regulated genes would fluctuate even if the inputs were held fixed, as a consequence of the intrinsic noise in the system, and such noise must fundamentally limit the reliability of any genetic computation. Here we use information theory to formalize the notion of information transmission in simple genetic regulatory elements in the presence of physically realistic noise sources. The dependence of this "channel capacity" on noise parameters, cooperativity and cost of making signaling molecules is explored systematically. We find that, in the range of parameters probed by recent in vivo measurements, capacities higher than one bit should be achievable. It is of course generally accepted that gene regulatory elements must, in order to function properly, have a capacity of at least one bit. The central point of our analysis is the demonstration that simple physical models of noisy gene transcription, with realistic parameters, can indeed achieve this capacity: it was not self-evident that this should be so. We also demonstrate that capacities significantly greater than one bit are possible, so that transcriptional regulation need not be limited to simple "on-off" components. The question whether real systems actually exploit this richer possibility is beyond the scope of this investigation.


Figures

FIG. 1
FIG. 1
(Color online) A schematic diagram of a simple regulatory element. Each input is mapped to a mean output according to the input-output relation (thick sigmoidal black line). Because the system is noisy, the output fluctuates about the mean. This noise is plotted in gray as a function of the input and shown in addition as error bars on the mean input-output relation. Inset shows the probability distribution of outputs at half saturation, p(g|c = Kd) (red dotted lines); in this simple example we assume that the distribution is Gaussian and therefore fully characterized by its mean and variance.
FIG. 2
FIG. 2
(Color online) An illustration of the large-noise approximation. We consider distributions of the output at minimal (cmin) and full (cmax) induction as trying to convey a single binary decision, and construct the corresponding encoding table (inset) by discretizing the output using the threshold Θ. The capacity of such an asymmetric binary channel is degraded from the theoretical maximum of 1 bit, because the distributions overlap (blue and red). For unclipped Gaussians the optimal threshold Θ is at the intersection of two alternative probability distributions, but in general one searches for the optimal Θ that maximizes information in Eq. (11).
FIG. 3
FIG. 3
(Color online) Information capacity (color code, in bits) as a function of input and output noise using the activator input-output relation with Gaussian noise given by Eq. (20) and no cooperativity (h = 1). (a) shows the exact capacity calculation (thick line) and the small-noise approximation (dashed line). (b) displays the details of the blue point in (a): the noise in the output is shown as a function of the input, with a peak that is characteristic of a dominant input noise contribution; also shown is the exact solution (thick black line) and the small-noise approximation (dashed black line) to the optimal distribution of output expression levels. (c) similarly displays details of the system denoted by a red dot in (a); here the output noise is dominant and both approximate and exact solutions for the optimal distribution of outputs show a trend monotonically decreasing with the mean output.
FIG. 4
FIG. 4
Difference in the information capacity between the re-pressors and activators (color code in bits). (a) shows Irep(h = 1) − Iact(h = 1), with the noise model that includes output (α) and input diffusion noise (β) contributions [see Fig. 3 for absolute values of Iact(h = 1)]. (b) shows IrepIact for the noise model that includes output noise (α)and input switching noise (γ) contributions; this plot is independent of cooperativity h.
FIG. 5
FIG. 5
(Color online) Comparison of exact channel capacities and various approximate solutions. For both panels [(a) no cooperativity, h = 1; (b) strong cooperativity, h = 3] we take a cross section through the noise plane in Fig. 3 along the main diagonal, where the values for noise strength parameters α and β are equal. The exact optimal solution is shown in red. By moving along the diagonal of the noise plane (and along the horizontal axis in the plots above) one changes both input and output noise by the same multiplicative factor s, and since, in the small-noise approximation, ISNA ∝log2 Z, Z = ∫ σg ( )−1dḡ, that factor results in an additive change in capacity by log2 s. We can use the large-noise-approximation lower bound on capacity for the case h = 1, in the parameter region where capacities fall below 1 bit.
FIG. 6
FIG. 6
(Color online) Effects of imposing realistic constraints on the space of allowed input distributions. (a) shows the change in capacity if the dynamic range of the input around Kd is changed (“25-fold range” means c ∈ [Kd/5,5Kd]). The regulatory element is a repressor with either no cooperativity (dashed line) or high cooperativity h=3 (thick line). We plot three high-low cooperativity pairs for different choices of the output noise magnitude (high noise in light gray, ln α ≈ −2.5; medium noise in dark gray, ln α ≈ −5; low noise in black, ln α ≈ −7.5). (b) shows the sensitivity of channel capacity to perturbations in the optimal input distribution. For various systems from Fig. 3 we construct suboptimal input distributions, as described in the text, compute the fraction of capacity lost relative to the unperturbed optimal solution, and plot this fraction against the optimal capacity of that system (black dots); extrapolated absolute capacity left when the input tends to be very different from optimal, i.e., DJS → 1, is plotted in red.
FIG. 7
FIG. 7
(Color online) Effects of metabolic or time costs on the achievable capacity of simple regulatory elements. Contours in (a) show the noise plane for noncooperative activator from Fig. 3, with the imposed constraint that the average total (input+output) cost is fixed to some C0; as the cost is increased, the optimal solution (green dot) moves along the arrows on a dark green line (A1); the contours change correspondingly, not shown. Light green line (A3) shows activator with cooperativity h=3, dark (R1) and light red lines (R3) show repressors without and with cooperativity (h=3). (b) shows the achievable capacity as a function of cost for each line in (a).
FIG. 8
FIG. 8
(Color online) Exact solutions (black) for input-output relations, p(g|c), compared to their Gaussian approximations (gray). (a) shows the distribution of outputs at maximal induction, p(g|cmax), for a system with a large burst size b=54 and a large output noise α = 1/6 (i.e., the average number of messages is 6, as is evident from the number of peaks, each of which corresponds to a burst of translation at different number of messages). (b) shows the same distribution for smaller output noise, b=52 and α=1/50; here the Gaussian approximation performs well. Both cases are computed with switching noise parameter γ=1/50 and cooperativity of h=2. (c) shows in color code the error made in computing the standard deviation of the output given c; the error measure we use is the maximum difference between the exact and Gaussian results over the full range of concentrations maxc abs{[σg(c)/g0]master − [σg(c)/g0]Gaussian}. As expected the error decreases with decreasing output noise. (d) shows that the capacity is overestimated by using an approximate kernel, but the error again decreases with decreasing noise as Langevin becomes an increasingly good approximation to the true distribution. In the worst case the approximation is about 12% off. The Gaussian computation depends only on α and not separately on burst size, so we plot only one curve for b=1.
FIG. 9
FIG. 9
(Color online) Robustness of the optimal solutions to perturbations in the input distribution. Activator systems with no cooperativity are plotted; their parameters are taken from a uniformly spaced 3×3 grid of points in the noise plane of Fig. 3(a), such that the output noise increases along the horizontal edge of the figure and the input noise along the vertical edge. Each subplot shows a scatter plot of 100 perturbations from the ideal solution; the Jensen-Shannon distance from the optimal solution, di, is plotted on the horizontal axis and the channel capacity (normalized to maximum when there is no perturbation), Ii/Imax, on the vertical axis. Red lines are best linear fits.

References

    1. Leloup JC, Goldbeter A. Proc Natl Acad Sci USA. 2003;100:7051. - PMC - PubMed
    1. Lawrence PA. The Making of a Fly: The Genetics of Animal Design. Blackwell; Oxford: 1992.
    1. Levine M, Davidson EH. Proc Natl Acad Sci USA. 2005;102:4936. - PMC - PubMed
    1. Gasch AP, Spellman PT, Kao CM, Carmel-Harel O, Eisen MB, Storz G, Botstein D, Brown PO. Mol Biol Cell. 2000;11:4241. - PMC - PubMed
    1. McAdams HH, Arkin A. Proc Natl Acad Sci USA. 1997;94:814. - PMC - PubMed

Publication types

Substances

LinkOut - more resources