

High variability in patterns of population decline: the importance of local processes in species extinctions
- PMID: 18765345
- PMCID: PMC2614245
- DOI: 10.1098/rspb.2008.0767
High variability in patterns of population decline: the importance of local processes in species extinctions
Abstract
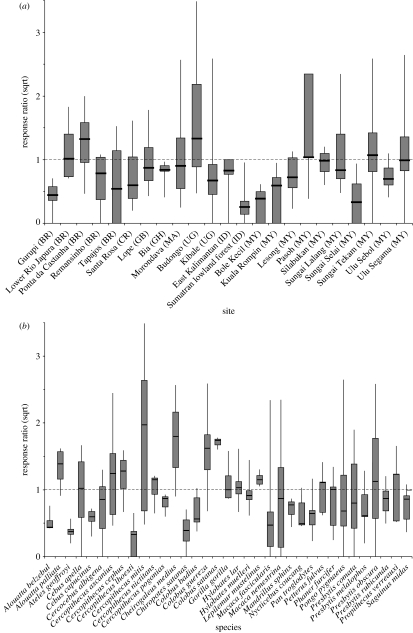
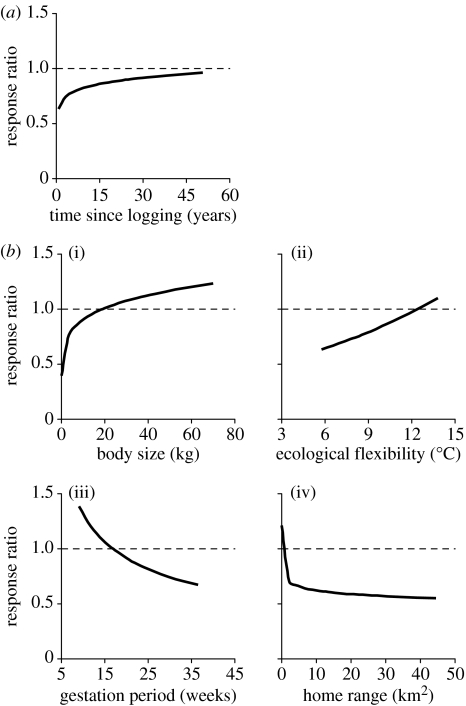
A fundamental goal of conservation science is to improve conservation practice. Understanding species extinction patterns has been a central approach towards this objective. However, uncertainty remains about the extent to which species-level patterns reliably indicate population phenomena at the scale of local sites, where conservation ultimately takes place. Here, we explore the importance of both species- and site-specific components of variation in local population declines following habitat disturbance, and test a suite of hypotheses about their intrinsic and extrinsic drivers. To achieve these goals, we analyse an unusually detailed global dataset for species responses to habitat disturbance, namely primates in timber extraction systems, using cross-classified generalized linear mixed models. We show that while there are consistent differences in the severity of local population decline between species, an equal amount of variation also occurs between sites. The tests of our hypotheses further indicate that a combination of biological traits at the species level, and environmental factors at the site level, can help to explain these patterns. Specifically, primate populations show a more marked decline when the species is characterized by slow reproduction, high ecological requirements, low ecological flexibility and small body size; and when the local environment has had less time for recovery following disturbance. Our results demonstrate that individual species show a highly heterogeneous, yet explicable, pattern of decline. The increased recognition and elucidation of local-scale processes in species declines will improve our ability to conserve biodiversity in the future.
Figures
Similar articles
-
Local and landscape correlates of primate distribution and persistence in the remnant lowland rainforests of the Upper Brahmaputra Valley, northeastern India.Conserv Biol. 2014 Feb;28(1):95-106. doi: 10.1111/cobi.12159. Epub 2013 Nov 1. Conserv Biol. 2014. PMID: 24471780
-
Predicting primate local extinctions within "real-world" forest fragments: a pan-neotropical analysis.Am J Primatol. 2014 Mar;76(3):289-302. doi: 10.1002/ajp.22233. Epub 2013 Nov 8. Am J Primatol. 2014. PMID: 24532182 Review.
-
How species respond to multiple extinction threats.Proc Biol Sci. 2004 Jun 7;271(1544):1135-41. doi: 10.1098/rspb.2004.2724. Proc Biol Sci. 2004. PMID: 15306363 Free PMC article.
-
Prediction of extinction in plants: interaction of extrinsic threats and life history traits.Ecology. 2007 Oct;88(10):2662-72. doi: 10.1890/06-1453.1. Ecology. 2007. PMID: 18027768
-
Why are there so many insect species? Perspectives from fossils and phylogenies.Biol Rev Camb Philos Soc. 2007 Aug;82(3):425-54. doi: 10.1111/j.1469-185X.2007.00018.x. Biol Rev Camb Philos Soc. 2007. PMID: 17624962 Review.
Cited by
-
Assessing Surveillance of Wildlife Diseases by Determining Mammal Species Vulnerability to Climate Change.Transbound Emerg Dis. 2023 Aug 17;2023:7628262. doi: 10.1155/2023/7628262. eCollection 2023. Transbound Emerg Dis. 2023. PMID: 40303742 Free PMC article.
-
Phylogenetic correlates of extinction risk in mammals: species in older lineages are not at greater risk.Proc Biol Sci. 2013 Jul 3;280(1765):20131092. doi: 10.1098/rspb.2013.1092. Print 2013 Aug 22. Proc Biol Sci. 2013. PMID: 23825210 Free PMC article.
-
A Severe Lack of Evidence Limits Effective Conservation of the World's Primates.Bioscience. 2020 Aug 26;70(9):794-803. doi: 10.1093/biosci/biaa082. eCollection 2020 Sep. Bioscience. 2020. PMID: 32973409 Free PMC article.
-
Living on the edge: genetic structure and geographic distribution in the threatened Markham's Storm-Petrel (Hydrobates markhami).PeerJ. 2021 Dec 24;9:e12669. doi: 10.7717/peerj.12669. eCollection 2021. PeerJ. 2021. PMID: 35036151 Free PMC article.
-
Avian responses to selective logging shaped by species traits and logging practices.Proc Biol Sci. 2015 Jun 7;282(1808):20150164. doi: 10.1098/rspb.2015.0164. Proc Biol Sci. 2015. PMID: 25994673 Free PMC article.
References
-
- Asner G.P, Knapp D.E, Broadbent E.N, Oliveira P.J.C, Keller M, Silva J.N. Selective logging in the Brazilian Amazon. Science. 2005;310:480–482. doi:10.1126/science.1118051 - DOI - PubMed
-
- Brook B.W, Traill L.W, Bradshaw C.J.A. Minimum viable population sizes and global extinction risk are unrelated. Ecol. Lett. 2006;9:375–382. doi:10.1111/j.1461-0248.2006.00883.x - DOI - PubMed
-
- Browne W.J, Goldstein H, Rasbash J. Multiple membership multiple classification (MMMC) models. Stat. Model. 2001;1:103–124. doi:10.1191/147108201128113 - DOI
-
- Cardillo M, Mace G.M, Jones K.E, Bielby J, Bininda-Emonds O.R.P, Sechrest W, Orme C.D.L, Purvis A. Multiple causes of high extinction risk in large mammal species. Science. 2005;309:1239–1241. doi:10.1126/science.1116030 - DOI - PubMed
-
- Ceballos G, Ehrlich P.R, Soberon J, Salazar I, Fay J.P. Global mammal conservation: what must we manage? Science. 2005;309:603–607. doi:10.1126/science.1114015 - DOI - PubMed
Publication types
MeSH terms
LinkOut - more resources
Full Text Sources
Molecular Biology Databases
