

doi: 10.1098/rsbl.2008.0363.
Human plague in the USA: the importance of regional and local climate
Affiliations
- PMID: 18765356
- PMCID: PMC2614152
- DOI: 10.1098/rsbl.2008.0363
Item in Clipboard
Human plague in the USA: the importance of regional and local climate
Biol Lett.
.
Abstract
A 56-year time series of human plague cases (Yersinia pestis) in the western United States was used to explore the effects of climatic patterns on plague levels. We found that the Pacific Decadal Oscillation (PDO), together with previous plague levels and above-normal temperatures, explained much of the plague variability. We propose that the PDO's impact on plague is conveyed via its effect on precipitation and temperature and the effect of precipitation and temperature on plague hosts and vectors: warmer and wetter climate leading to increased plague activity and thus an increased number of human cases. Our analysis furthermore provides insights into the consistency of plague mechanisms at larger scales.
Figures
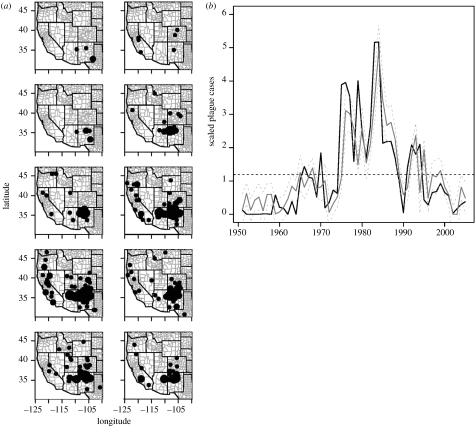
(a) Location and intensity of plague every five years from 1950 to 2005. Periods of low and high plague levels are well distributed over the study area. Particularly, outbreaks occur synchronously throughout the west, suggesting large-scale climate forcing. Circles are located at the centroid of the 105 counties reporting plague, their size being proportional to the number of scaled cases. (b) Observed and predicted (model M1, equation (3.1)) number of human plague cases adjusted for population density for the western United States. Plague was modelled using previous plague levels, PDO (March value) and the yearly count of days above 37°C. Black solid line, observed plague; black dashed line, mean plague value; grey solid line, predicted plague; grey dashed line, 95% CI.
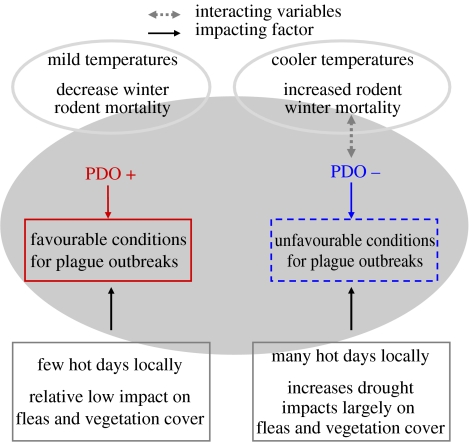
Diagram showing how climate affects plague dynamics. The regional climate together with local events determines the conditions for plague outbreaks.
References
-
- Brown J.H, Heske E.J. Temporal changes in a Chihuahuan Desert rodent community. Oikos. 1990;59:290–302. doi:10.2307/3545139 - DOI
-
- Cavanaugh D.C. Specific effect of temperature upon transmission of the plague bacillus by the oriental rat flea, Xenopsylla Cheopis. Am. J. Trop. Med. Hyg. 1971;20:264–273. - PubMed
-
- Craven R.B, Maupin G.O, Beard M.L, Quan T.J, Barnes A.M. Reported cases of human plague infections in the United States, 1970–1991. J. Med. Entomol. 1993;130:758–761. - PubMed
-
- Daszak P, Cunningham A.A, Hyatt A.D. Emerging infectious diseases of wildlife—threats to biodiversity and human health. Emerg. Infect. Dis. 2000;287:443–449. doi:10.1126/science.287.5452.443 - DOI - PubMed
-
- Davis S, Begon M, De Bruyn L, Ageyev V.S, Klassovskiy N.L, Pole S.B, Viljugrein H, Stenseth N.C, Leirs H. Predictive thresholds for plague in Kazakhstan. Science. 2004;304:736–738. doi:10.1126/science.1095854 - DOI - PubMed
MeSH terms
LinkOut - more resources
Full Text Sources
Medical