Diversification in a fluctuating island setting: rapid radiation of Ohomopterus ground beetles in the Japanese Islands
- PMID: 18765360
- PMCID: PMC2607372
- DOI: 10.1098/rstb.2008.0111
Diversification in a fluctuating island setting: rapid radiation of Ohomopterus ground beetles in the Japanese Islands
Abstract
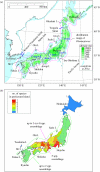
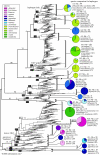
The Japanese Islands have been largely isolated from the East Asian mainland since the Early Pleistocene, allowing the diversification of endemic lineages. Here, we explore speciation rates and historical biogeography of the ground beetles of the subgenus Ohomopterus (genus Carabus) based on nuclear and mitochondrial gene sequences. Ohomopterus diverged into 15 species during the Pleistocene. The speciation rate was 1.92 Ma(-1) and was particularly fast (2.37 Ma(-1)) in a group with highly divergent genitalia. Speciation occurred almost solely within Honshu, the largest island with complex geography. Species diversity is highest in central Honshu, where closely related species occur parapatrically and different-sized species co-occur. Range expansion of some species in the past has resulted in such species assemblages. Introgressive hybridization, at least for mitochondrial DNA, has occurred repeatedly between species in contact, but has not greatly disturbed species distinctness. Small-island populations of some species were separated from main-island populations only after the last glacial (or the last interglacial) period, indicating that island isolation had little role in speciation. Thus, the speciation and formation of the Ohomopterus assemblage occurred despite frequent opportunities for secondary contact and hybridization and the lack of persistent isolation. This radiation was achieved without substantial ecological differentiation, but with marked differentiation in mechanical agents of reproductive isolation (body size and genital morphology).
Figures


Similar articles
-
Extensive trans-species mitochondrial polymorphisms in the carabid beetles Carabus subgenus Ohomopterus caused by repeated introgressive hybridization.Mol Ecol. 2001 Dec;10(12):2833-47. doi: 10.1046/j.1365-294x.2001.t01-1-01404.x. Mol Ecol. 2001. PMID: 11903896
-
Mechanical barriers to introgressive hybridization revealed by mitochondrial introgression patterns in Ohomopterus ground beetle assemblages.Mol Ecol. 2007 Nov;16(22):4822-36. doi: 10.1111/j.1365-294X.2007.03569.x. Mol Ecol. 2007. PMID: 18028179
-
Reproductive Character Displacement in Genital Morphology in Ohomopterus Ground Beetles.Am Nat. 2022 Mar;199(3):E76-E90. doi: 10.1086/717864. Epub 2022 Feb 1. Am Nat. 2022. PMID: 35175894
-
Historical divergence of mechanical isolation agents in the ground beetle Carabus arrowianus as revealed by phylogeographical analyses.Mol Ecol. 2009 Apr;18(7):1408-21. doi: 10.1111/j.1365-294X.2009.04117.x. Mol Ecol. 2009. PMID: 19368646
-
The importance of migratory drop-off for island colonization in birds.Proc Biol Sci. 2024 Apr 30;291(2021):20232926. doi: 10.1098/rspb.2023.2926. Epub 2024 Apr 17. Proc Biol Sci. 2024. PMID: 38628117 Free PMC article.
Cited by
-
Phylogeography of freshwater planorbid snails reveals diversification patterns in Eurasian continental islands.BMC Evol Biol. 2018 Nov 6;18(1):164. doi: 10.1186/s12862-018-1273-3. BMC Evol Biol. 2018. PMID: 30400816 Free PMC article.
-
Ecological differentiation and habitat unsuitability maintaining a ground beetle hybrid zone.Ecol Evol. 2015 Dec 15;6(1):113-24. doi: 10.1002/ece3.1814. eCollection 2016 Jan. Ecol Evol. 2015. PMID: 26811778 Free PMC article.
-
Terrestrial mountain islands and Pleistocene climate fluctuations as motors for speciation: A case study on the genus Pseudovelia (Hemiptera: Veliidae).Sci Rep. 2016 Sep 21;6:33625. doi: 10.1038/srep33625. Sci Rep. 2016. PMID: 27650911 Free PMC article.
-
Transfer of elements from soil to earthworms and ground beetles in boreal forest.Radiat Environ Biophys. 2023 Aug;62(3):403-414. doi: 10.1007/s00411-023-01027-2. Epub 2023 Apr 17. Radiat Environ Biophys. 2023. PMID: 37067570 Free PMC article.
-
Introduction. Evolution on Pacific islands: Darwin's legacy.Philos Trans R Soc Lond B Biol Sci. 2008 Oct 27;363(1508):3289-91. doi: 10.1098/rstb.2008.0127. Philos Trans R Soc Lond B Biol Sci. 2008. PMID: 18765364 Free PMC article. No abstract available.
References
-
- Arnqvist G. Comparative evidence for the evolution of genitalia by sexual selection. Nature. 1998;393:784–786. doi:10.1038/31689 - DOI
-
- Britton T, Anderson C.L, Jacquet D, Lundqvist S, Bremer K. Estimating divergence times in large phylogenetic trees. Syst. Biol. 2007;56:741–752. doi:10.1080/10635150701613783 - DOI - PubMed
-
- Clement M, Posada D, Crandall K.A. TCS: a computer program to estimate gene genealogies. Mol. Ecol. 2000;9:1657–1660. doi:10.1046/j.1365-294x.2000.01020.x - DOI - PubMed
-
- Coyne J.A, Orr H.A. Sinauer; Sunderland, MA: 2004. Speciation.
-
- Dobson M, Kawamura Y. Origin of the Japanese land mammal fauna: allocaton of extant species to historically-based categories. Quat. Res. (Daiyonki-kenkyu) 1998;37:385–395.
Publication types
MeSH terms
Substances
LinkOut - more resources
Full Text Sources
Molecular Biology Databases
Miscellaneous

