. 2008 Dec;93(12):4656-63.
doi: 10.1210/jc.2008-1030. Epub 2008 Sep 2.

Mechanism for improved insulin sensitivity after gastric bypass surgery

Affiliations

Mechanism for improved insulin sensitivity after gastric bypass surgery

Benjamin T Bikman et al. J Clin Endocrinol Metab. 2008 Dec.

Abstract

Context: Surgical treatments of obesity have been shown to induce rapid and prolonged improvements in insulin sensitivity.

Objective: The aim of the study was to investigate the effects of gastric bypass surgery and the mechanisms that explain the improvement in insulin sensitivity.

Design: We performed a cross-sectional, nonrandomized, controlled study.

Setting: This study was conducted jointly between the Departments of Exercise Science and Physiology at East Carolina University in Greenville, North Carolina.

Subjects: Subjects were recruited into four groups: 1) lean [body mass index (BMI) < 25 kg/m(2); n = 93]; 2) weight-matched (BMI = 25 to 35 kg/m(2); n = 310); 3) morbidly obese (BMI > 35 kg/m(2); n = 43); and 4) postsurgery patients (BMI approximately 30 kg/m(2); n = 40). Postsurgery patients were weight stable 1 yr after surgery.

Main outcome measures: Whole-body insulin sensitivity, muscle glucose transport, and muscle insulin signaling were assessed.

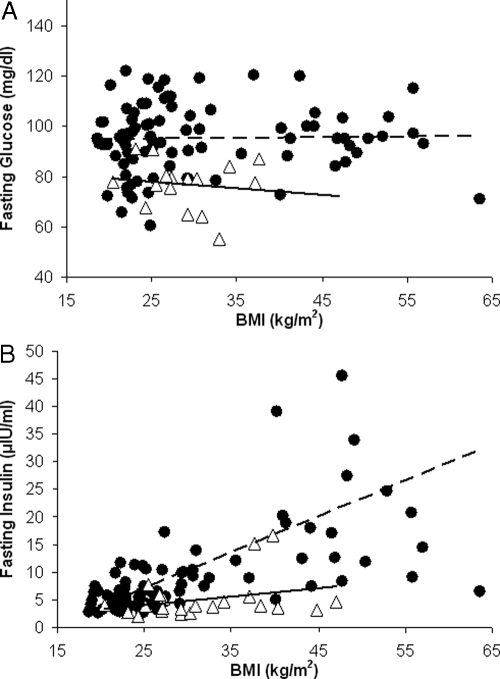
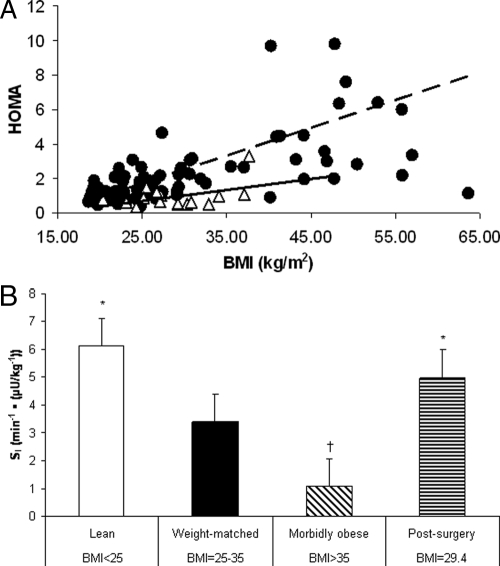
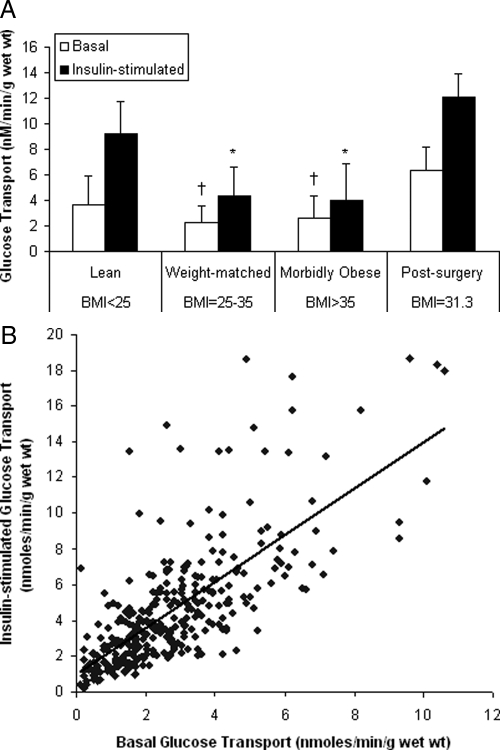
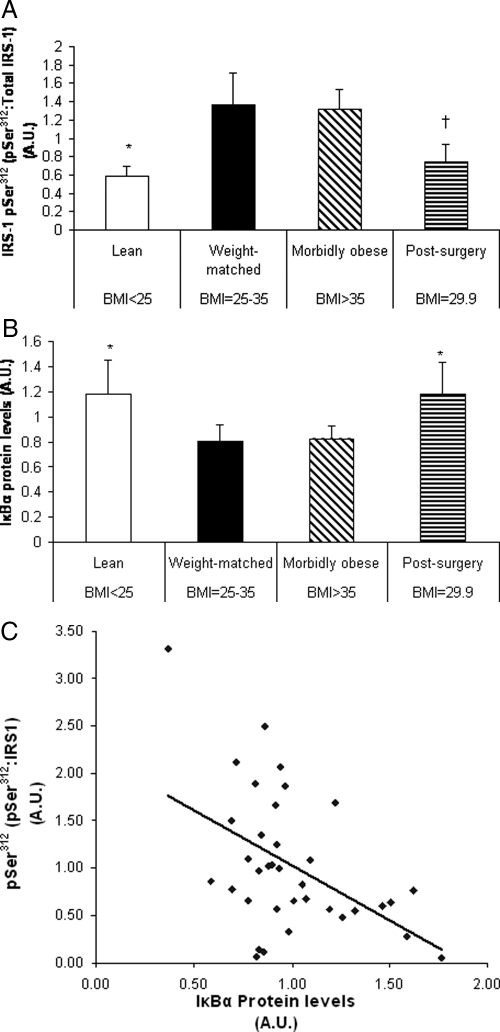
Results: Postsurgery subjects had insulin sensitivity index values that were similar to the lean and higher than morbidly obese and weight-matched control subjects. Glucose transport was higher in the postsurgery vs. morbidly obese and weight-matched groups. IRS1-pSer(312) in the postsurgery group was lower than morbidly obese and weight-matched groups. Inhibitor kappaBalpha was higher in the postsurgery vs. the morbidly obese and weight-matched controls, indicating reduced inhibitor of kappaB kinase beta activity.

Conclusions: Insulin sensitivity and glucose transport are greater in the postsurgery patients than predicted from the weight-matched group, suggesting that improved insulin sensitivity after bypass is due to something other than, or in addition to, weight loss. Improved insulin sensitivity is related to reduced inhibitor of kappaB kinase beta activity and enhanced insulin signaling in muscle.


Figures

Figure 1
Figure 1
The correlations between BMI and glucose (A) and insulin (B) for nonsurgery control subjects (black circles) and postsurgery patients (white triangles). The data are from experiment 1 patients (Table 1). A, The comparison of fasting glucose values between nonsurgery control subjects (n = 97) and postsurgery subjects (n = 31). B, Fasting insulin values between nonsurgery subjects and postsurgery subjects. A positive and significant correlation was found (P < 0.001, r = 0.598) for the nonsurgery subjects. The same correlation in postsurgery subjects revealed no significant relationship (P = 0.169, r = 0.304).
Figure 2
Figure 2
Whole-body insulin sensitivity determined by HOMA correlated with BMI (A) and IVGTT for four BMI groups (B). The data for the HOMA and insulin sensitivity analysis were taken from experiment 1 (Table 1). A, The comparison of HOMA values for nonsurgery control subjects (black circles) and postsurgery patients (white triangles). A positive and significant correlation between HOMA and BMI was found (P < 0.01, r = 0.283) for the nonsurgery subjects. The same correlation in postsurgery subjects revealed no significant relationship (P = 0.083, r = 0.446). B, The difference in whole-body insulin sensitivity between BMI groups. *, The postsurgery and lean groups are statistically higher (P < 0.005) than the morbidly obese and weight-matched groups. †, P < 0.05 for the comparison between the morbidly obese and all other groups. Data are presented as mean ± sd.
Figure 3
Figure 3
2-Deoxy-d-glucose uptake in incubated muscle strips in the presence (100 nm) or absence of insulin (A) and the correlation between basal and insulin-stimulated glucose transport (B). The data were obtained from subjects in experiment 2 (Table 1). A, A comparison of basal (empty bars) and insulin-stimulated (filled bars) glucose transport. *, Insulin-stimulated glucose transport in the morbidly obese and weight-matched groups was statistically lower (P < 0.05) than the lean and postsurgery groups. †, Basal glucose transport in the morbidly obese and weight-matched groups was statistically lower (P < 0.05) than the lean and postsurgery groups. Basal and insulin-stimulated glucose transport in muscle from morbidly obese subjects did not differ from the weight-matched subjects. B, The correlation between basal and insulin-stimulated glucose transport revealed a highly significant relationship (P < 0.001; r =0.726). Data are presented as mean ± sd.
Figure 4
Figure 4
Muscle levels of IRS1-phospho-Ser312 (A) and IκBα (B), and the correlation between IRS1-pSer312 and IκBα (C). Nonsurgery control subjects and postsurgery patients were from experiment 3 (Table 1). A, Western blot analysis of serine312 phosphorylation of IRS1. *, P < 0.05 for the comparison between the lean group and the morbidly obese and weight-matched. †, P < 0.05 for the comparison between the postsurgery and the morbidly obese groups. The postsurgery group tended to have a lower level compared with the weight-matched group (P = 0.057). B, Western blot analysis of IκBα in skeletal muscle between groups. *, P < 0.05 for the observation that the lean and postsurgery groups were statistically higher than the morbidly obese and weight-matched groups. IκBα levels were similar between postsurgery subjects and lean subjects. C, The correlation between IκBα and IRS1-phospho-Ser312 levels between nonsurgery and postsurgery subjects (P = 0.003, R = −0.47). Data are presented as mean ± sd.

Similar articles

Cited by

References

    1. Friedman JE, Dohm GL, Leggett-Frazier N, Elton CW, Tapscott EB, Pories WP, Caro JF 1992 Restoration of insulin responsiveness in skeletal muscle of morbidly obese patients after weight loss. Effect on muscle glucose transport and glucose transporter GLUT4. J Clin Invest 89:701–705 - PMC - PubMed
    1. Pories WJ 1992 Why does the gastric bypass control type 2 diabetes mellitus? Obes Surg 2:303–313 - PubMed
    1. Pories WJ, MacDonald Jr KG, Flickinger EG, Dohm GL, Sinha MK, Barakat HA, May HJ, Khazanie P, Swanson MS, Morgan E, Leggett-Frazier N, Long SD, Brown BM, O'Brien K, Caro JF 1992 Is type II diabetes mellitus (NIDDM) a surgical disease? Ann Surg 215:633–642; discussion, 643 - PMC - PubMed
    1. Dixon JB, O'Brien PE, Playfair J, Chapman L, Schachter LM, Skinner S, Proietto J, Bailey M, Anderson M 2008 Adjustable gastric banding and conventional therapy for type 2 diabetes: a randomized controlled trial. JAMA 299:316–323 - PubMed
    1. Buchwald H, Avidor Y, Braunwald E, Jensen MD, Pories W, Fahrbach K, Schoelles K 2004 Bariatric surgery: a systematic review and meta-analysis. JAMA 292:1724–1737 - PubMed

Publication types