

Proxy-based reconstructions of hemispheric and global surface temperature variations over the past two millennia
- PMID: 18765811
- PMCID: PMC2527990
- DOI: 10.1073/pnas.0805721105
Proxy-based reconstructions of hemispheric and global surface temperature variations over the past two millennia
Abstract
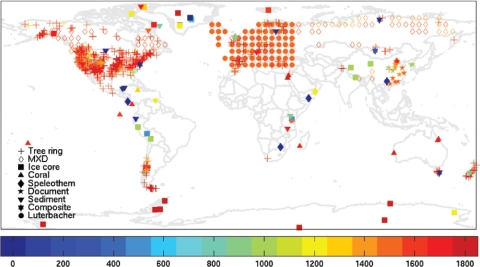
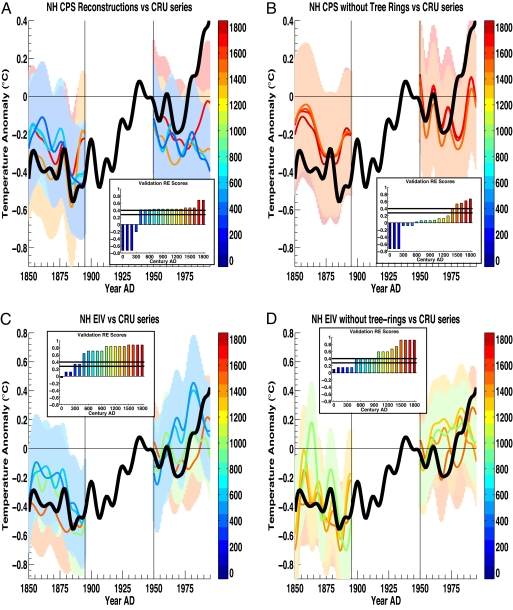
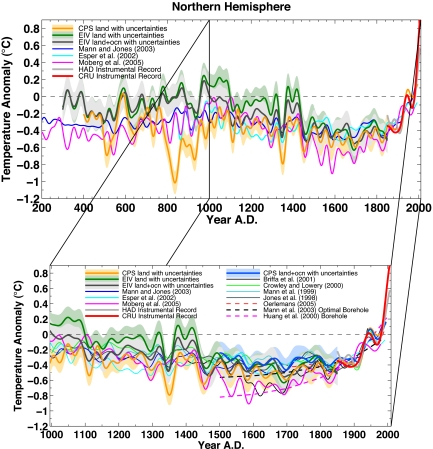
Following the suggestions of a recent National Research Council report [NRC (National Research Council) (2006) Surface Temperature Reconstructions for the Last 2,000 Years (Natl Acad Press, Washington, DC).], we reconstruct surface temperature at hemispheric and global scale for much of the last 2,000 years using a greatly expanded set of proxy data for decadal-to-centennial climate changes, recently updated instrumental data, and complementary methods that have been thoroughly tested and validated with model simulation experiments. Our results extend previous conclusions that recent Northern Hemisphere surface temperature increases are likely anomalous in a long-term context. Recent warmth appears anomalous for at least the past 1,300 years whether or not tree-ring data are used. If tree-ring data are used, the conclusion can be extended to at least the past 1,700 years, but with additional strong caveats. The reconstructed amplitude of change over past centuries is greater than hitherto reported, with somewhat greater Medieval warmth in the Northern Hemisphere, albeit still not reaching recent levels.
Conflict of interest statement
The authors declare no conflict of interest.
Figures
Comment in
-
Proxy inconsistency and other problems in millennial paleoclimate reconstructions.Proc Natl Acad Sci U S A. 2009 Feb 10;106(6):E10; author reply E11. doi: 10.1073/pnas.0812509106. Epub 2009 Feb 2. Proc Natl Acad Sci U S A. 2009. PMID: 19188613 Free PMC article. No abstract available.
References
-
- Folland CK, et al. Observed climate variability and change. In: Houghton JT, et al., editors. Climate Change 2001: The Scientific Basis. Cambridge, UK: Cambridge Univ Press; 2001. pp. 99–181.
-
- Jansen EJ, et al. Palaeoclimate. In: Solomon S, et al., editors. Climate Change 2007: The Physical Science Basis. Contribution of Working Group I to the Fourth Assessment Report of the Intergovernmental Panel on Climate Change. Cambridge, UK: Cambridge Univ Press; 2007.
-
- Bradley RS, Jones PD. “Little Ice Age” summer temperature variations: Their nature and relevance to recent global warming trends. Holocene. 1993;3:367–376.
-
- Mann ME, Bradley RS, Hughes MK. Northern Hemisphere temperatures during the past millennium: Inferences, uncertainties, and limitations. Geophys Res Lett. 1999;26:759–762.
-
- Briffa KR, Jones PD, Schweinbruger FH, Osborn TJ. Influence of volcanic eruptions on Northern Hemisphere summer temperatures over the past 600 years. Nature. 1998;393:450–454.
Publication types
MeSH terms
LinkOut - more resources
Full Text Sources
Other Literature Sources
Miscellaneous
