. 2008 Sep 2;1(35):ra1.
doi: 10.1126/scisignal.1159945.

The extracellular calcium-sensing receptor (CaSR) is a critical modulator of skeletal development

Affiliations

The extracellular calcium-sensing receptor (CaSR) is a critical modulator of skeletal development

Wenhan Chang et al. Sci Signal. .

Abstract

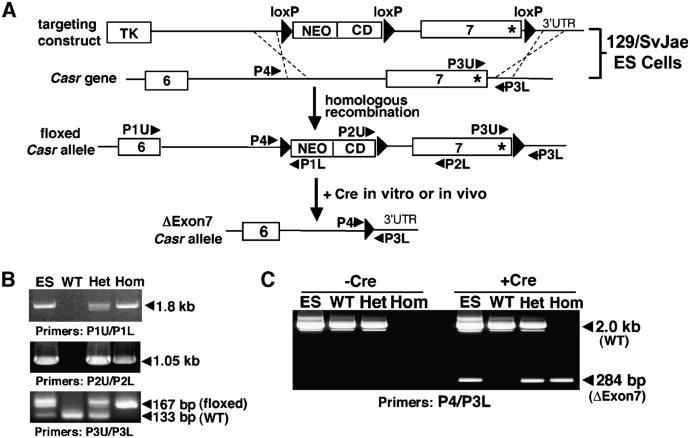
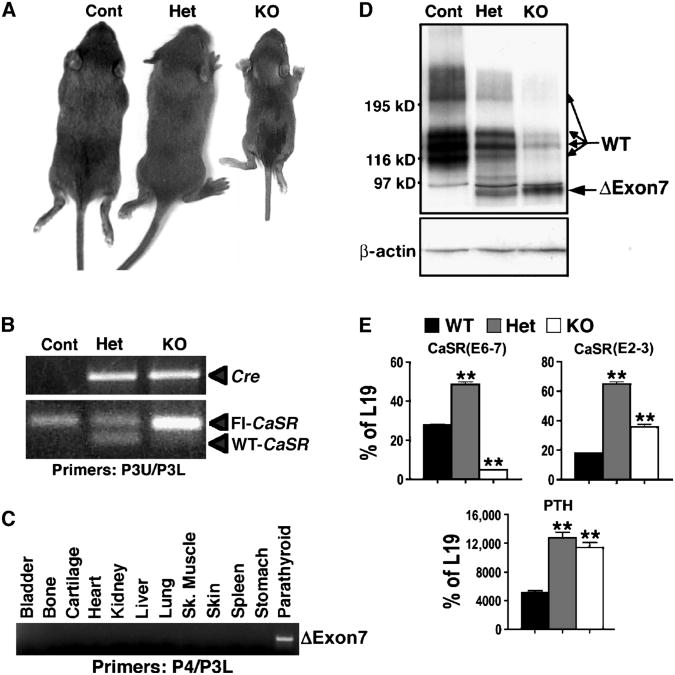
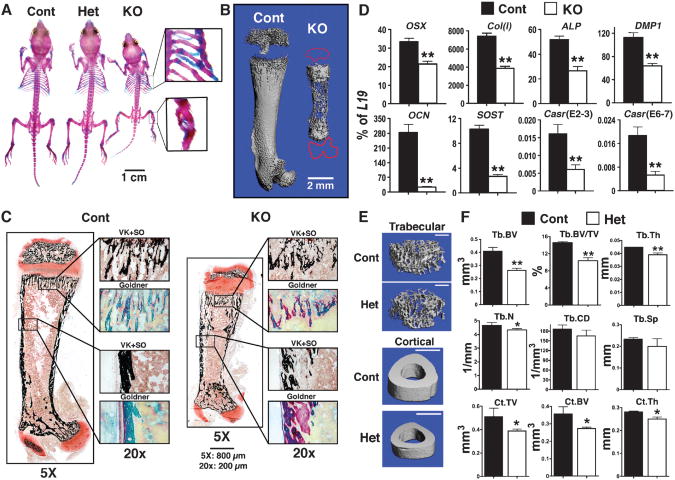
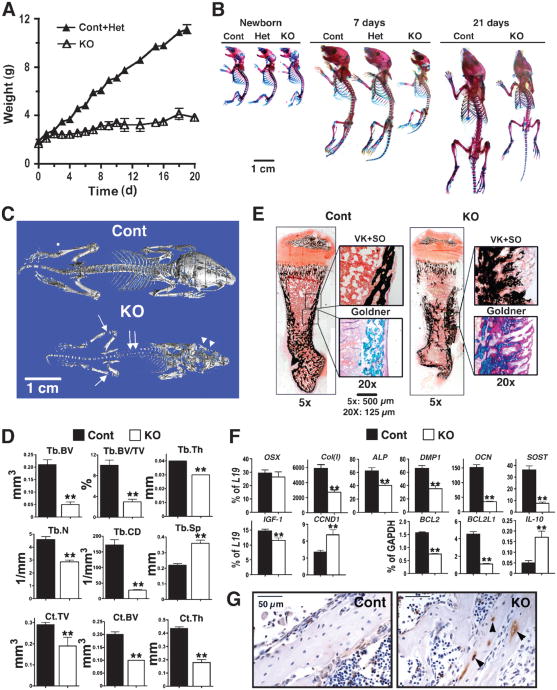
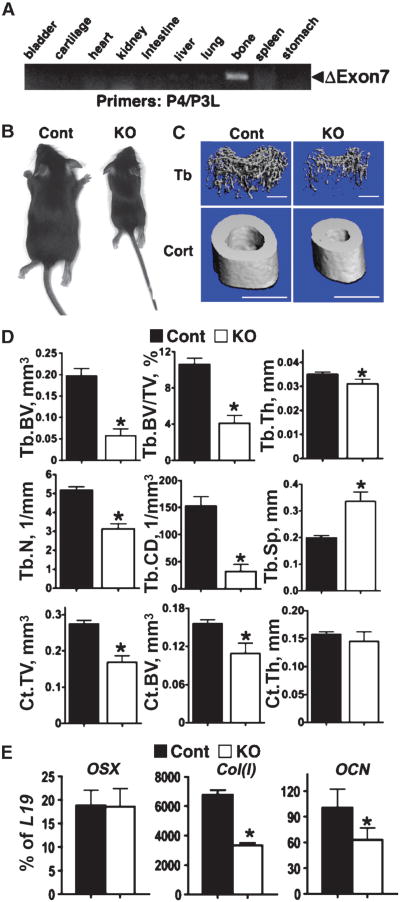
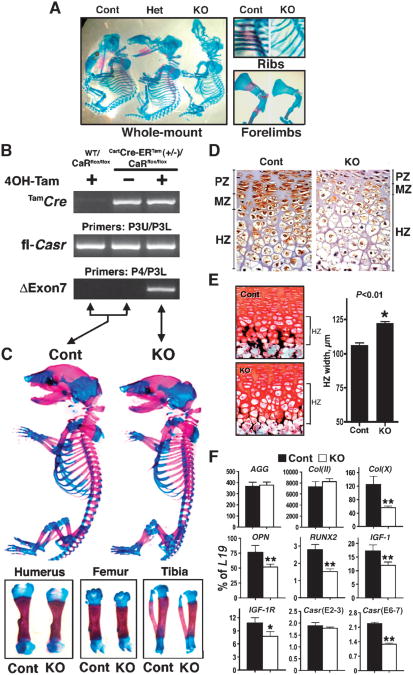
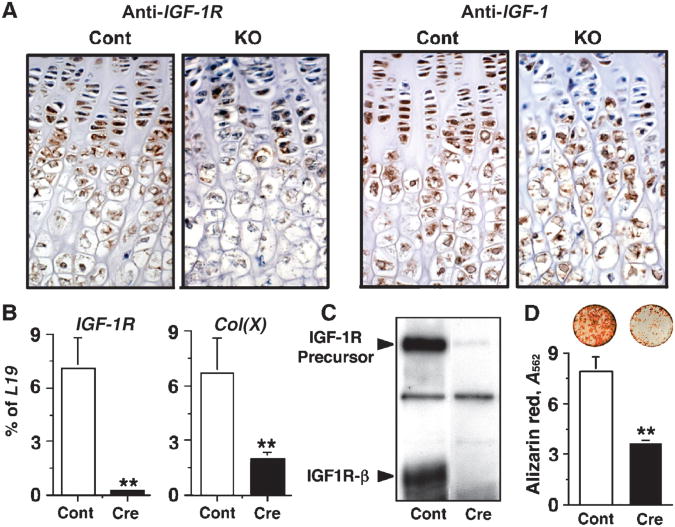
The extracellular Ca(2+)-sensing receptor (CaSR) plays a nonredundant role in the functions of the parathyroid gland (PTG) and the kidney. Severe hyperparathyroidism, premature death, and incomplete gene excision in Casr(-/-) mice have precluded the assessment of CaSR function in other tissues. We generated mice with tissue-specific deletion of Casr in the PTG, bone, or cartilage. Deletion of Casr in the PTG or bone resulted in profound bone defects, whereas deletion of Casr in chondrocytes (cartilage-producing cells) resulted in death before embryonic day 13 (E13). Mice in which chondrocyte-specific deletion of Casr was induced between E16 and E18 were viable but showed delayed growth plate development. Our data show a critical role for the CaSR in early embryogenesis and skeletal development.


Figures

Fig. 1
Fig. 1
Generation of floxed Casr mice. (A) The gene-targeting strategy used to introduce loxP sequences to flank exon 7 of Casr required a construct containing three loxP sites flanking exon 7 of the Casr gene and the cytidine deaminase (CD)–neomycin (NEO) gene cassette. This construct was trans-fected into 129/SvJae ES cells to allow homologous recombination with endogenous Casr alleles. The resulting floxed Casr-containing ES cells were injected into C57/BL6 blastocysts to produce chimeric mice that were bred to obtain heterozygous (Casrwt/flox) and homozygous (Casrflox/flox) mice. (B) PCR analyses of genomic DNAs from floxed Casr-containing ES cells before blastocyst injection and from the tails of Casrwt/wt (WT), heterozygous Casrwt/flox (Het), and homozygous Casrflox/flox (Hom) mice were performed with specific primers (see Materials and Methods) to confirm integration of the targeting sequences. (C) PCR analyses of genomic DNAs from (B) after incubation with (+Cre) or without (−Cre) bacteriophage P1 Cre recombinase in vitro for 30 min. The 284-bp band represents the DNA fragment due to excision of exon 7 (ΔExon7).
Fig. 2
Fig. 2
Heterozygous and homozygous deletion of the Casr gene in parathyroid cells (PTCs) produces mild and severe hyperparathyroidism (HPT), respectively. (A) Two-week-old PT-KO (PTCaSRΔflox/Δflox) mice showed severe growth retardation, with body weights about 45% of that of their control and PT-Het (PTCaSRWT/Δflox) littermates. (B) PCR analyses of genomic DNAs confirmed the expression of the Cre trans-gene and floxed Casr alleles in PT-Het and PT-KO mice. The control mice used in this experiment were CaSRflox/flox, which do not express Cre. (C) PCR analyses of genomic DNAs from tissues of PT-KO mice confirmed the deletion of exon 7 only in PTGs. (D) Western blotting of PTG lysates showed the decreased abundance of full-length CaSR protein (WT, 120 to 250 kD) by ∼70% and >95% in the PT-Het and PT-KO mice, respectively, compared with control littermates. PTG ly-sates from PT-Het and PT-KO mice contained the ΔExon7-CaSR (ΔExon7) protein (about 90 kD), which was encoded by exons 1 to 6. (E) qPCR analyses with primers flanking the junctions of either exons 6 and 7 (E6-7) or exons 2 and 3 (E2-3) of Casr and primers specific for PTH mRNA were presented as the percentage of expression of the gene encoding the mitochondrial ribosomal protein L19 (**P < 0.01, n = 4 to 6 mice).
Fig. 3
Fig. 3
Knockout of Casr in PTCs impedes skeletal development. (A) Whole-mount AR and AB staining showed a smaller skeleton with fractures in the ribs and tibiae (see insets) of 14-day-old PT-KO (PTCasrΔflox/Δflox) mice, but not in PT-Het (PTCaSRWT/Δflox) orcontrol mice. (B) Reconstructed 3D μCT images of femurs from 14-day-old PT-KO mice showed severely undermineralized matrix compared with those of control mice. (C) Histological analyses of femurs from PT-KO mice showed reduced mineralization and osteoid accumulation. Consecutive plastic-embedded femur sections from 14-day-old control and PT-KO mice stained with VK reagents and counterstained with SO or Goldner reagents were visualized at 5× magnification. Boxes in the right panels are enlarged regions of interest (reproduced at 20×). Scale bars: 800 μm at 5×; 200 μm at 20×. (D) Gene expression studies indicated the delayed differentiation of osteoblasts in bones from PT-KO mice compared with that of control mice. qPCR analyses of genes encoding osteoblast markers were performed on RNA isolated from humeral cortices (no marrow) of 14-day-old mice. All measurements of gene expression are presented as the percentage of L19 expression (*P < 0.05, **P < 0.01; n = 6 to 8 mice). Expression of OSX, Col(I), ALP, DMP1, OCN, and SOST in PT-KO mice was reduced by 36%, 48%, 48%, 43%, 91%, and 74%, respectively, compared with that in control mice. PCR analyses with primers flanking the junctions of exons 6 and 7 (E6-7) or exons 2 and 3 (E2-3) of Casr showed reductions in both transcripts in bone in which the PTH-Cre transgene was not expressed. (E) Reconstructed 3D μCT images of Tb bone in distal femurs and Ct bone at the TFJ of 6-month-old control and PT-Het mice. Scale bars: 1 mm for all panels. (F) μCT parameters assessed were BV, BV/TV, Th, N, CD, and Sp for Tb bone and TV, BV, and Th for Ct bone (defined in Results; *P < 0.05, **P < 0.01; n = 6 to 8 mice).
Fig. 4
Fig. 4
Knockout of Casr in osteoblasts, driven by 2.3Col(I)-Cre, blocked growth and skeletal development. (A) Body weights of control (n = 8), heterozygous (Col-BoneCasrWT/Δflox, COL-Het, n = 12), and homozygous KO (Col-BoneCasrΔflox/Δflox, COL-KO, n = 9) mice from birth until postnatal day 20. Because the weights of control and Het mice were indistinguishable, they were combined and are presented as Cont+Het. COL-KO mice exhibited growth retardation, which was evident by postnatal day 3. (B) Whole-mount AR and AB staining showed that the skeletons of COL-KO mice were smaller than those of control and heterozygous mice at postnatal day 5. (C) Reconstructed 3D μCT images of skeletons from 20-day-old mice showed severe undermineralization in COL-KO mice, evident in the skull (arrowheads), vertebrae (double arrows), and long bones (arrows). (D) μCT parameters of Tb bone in the distal femur (Tb.BV, Tb.BV/TV, Tb.Th, Tb.N, Tb.CD, and Tb.Sp) and Ct bone at the TFJ (Ct.TV, Ct.BV, and Ct.Th) of 20-day-old control and COL-KO mice showed statistically significant reductions in all parameters except Tb. Sp, which was markedly increased—all of which were confirmatory of reduced bone mass and microarchitecture (**P < 0.01; n = 6 mice). (E) Histological analyses of femurs from COL-KO mice showed poor mineralization and osteoid accumulation compared with those of control mice. VK+SO and Goldner staining were performed on consecutive plastic-embedded sections from 7-day-old control and COL-KO femurs and visualized at 5× magnification. Boxes in the right panels are enlarged regions of interest (reproduced at 20×). Scale bars: 500 μm (5×); 125 μm (20×). (F) The expression of genes encoding osteoblast markers indicated delayed differentiation in COL-KO mice compared with that in control mice. qPCR analyses of samples isolated from humeral cortices (no marrow) from 14-day-old mice with primers specific for OSX, Col(I), ALP, DMP1, OCN, SOST, IGF-1, CCND1, Bcl-2, Bcl-2L1, and IL-10 were performed. Results are presented as the percentage of expression of L19 or glyceraldehyde 3-phosphate dehydrogenase(GAPDH) (**P < 0.01; n = 6 to 9 mice). Reductions (percent decrease in COL-KO mice compared with control mice) of 54%, 35%, 47%, 77%, 79%, and 22% were seen in the expression of Col(I), ALP, DMP1, OCN, SOST, and IGF-1, respectively. (G) TUNEL staining of femoral cortex from 7-day-old control and KO mice with hematoxylin counter-staining. TUNEL-positive cells are indicated by brown DAB stain (arrowheads) (n = 8 sections from four mice).
Fig. 5
Fig. 5
Knockout of floxed Casr in osteoblasts by OSX-Cre results in retarded growth and altered gene expression. (A) PCR analyses of genomic DNAs confirmed that deletion of exon 7 occurred only in bone from homozygous Osx-BoneCasrΔflox/Δflox (OSX-KO) mice and not in other tissues. (B) One-month-old OSX-KO mice were growth-retarded compared with control mice. (C) μCT images of trabecular (Tb) and cortical (Ct) bones in the distal femur and TFJ, respectively, showed severely under-mineralized matrix in 4-week-old KO mice compared with that in control mice. Scale bars: 1 mm for all panels. (D) μCT parameters assessed included BV, BV/TV, Th,N,CD, and SpforTbbone and TV, BV, and Th for Ct bone in 4-week-old control and OSX-KO mice. (*P < 0.01; n = 6 for KO and n = 12 for control mice). (E) Analysis of gene expression by qPCR in samples isolated from humeral cortices (no marrow) of newborn mice indicated delayed differentiation of osteoblasts in OSX-KO mice compared with that of control mice, with 55% reduced expression of Col(I) and 35% reduced expression of OCN. Results are presented as the percentage of L19 expression (*P < 0.05, n = 4 to 6 mice).
Fig. 6
Fig. 6
Knockout of Casr in chondrocytes blocks embryonic development and cartilage maturation. (A) Whole-mount AR and AB staining shows that the skeletons of Cart-KO (CartCasrΔflox/Δflox) mice are smaller and undermineralized compared with those of their heterozygous (CartCasrWT/Δflox) and control littermates at E12.5. (B to F) Tamoxifen (Tam)-induced knockdown of the Casr in cartilage produces small, undermineralized skeletons in E18-19 Tam-CartCasrΔflox/Δflox (Tam-Cart-KO) embryos. (B) PCR analysis of genomic DNAs from embryos with (+) or without (−) exposure to 4OH-Tam for the expression ofthe TamCre transgene, homozygous floxed Casr (fl-Casr) alleles, and sequences lacking exon 7 (ΔExon7). (C) Whole-mount AR and AB staining of E19 embryos showed smaller skeletons, including humeri, femurs, and tibiae in Tam-Cart-KO compared with those of control mice. (D) Immunohistochemical staining of CaSR, depicted by brown DAB staining, in the proximal tibial growth plates from E18 to E19 Tam-Cart-KO and control mice. PZ, proliferation zone; MZ, maturation zone; HZ, hypertrophic zone. (E) VK and SO staining of plastic sections of proximal tibial growth plates from E18 to E19 Tam-Cart-KO and control mice. The histogram presents HZ widths in proximal tibial growth plates from control and Tam-Cart-KO mice (*P < 0.01; n = 4 mice). (F) Gene profiling in the epiphyseal growth plates indicates a delay in cell maturation and differentiation in Tam-Cart-KO mice compared with that in control mice. qPCR was performed on epiphyseal growth plate samples from E18 to E19 Tam-Cart-KO and control mice with primers specific for early [AGG and Col(II)] and late [Col(X), OPN, and RUNX2] chondrocyte markers and for IGF-1, IGF-1R, and Casr. Results are presented as the percentage of L19 expression (*P < 0.05, **P < 0.01; n = 6 mice).
Fig. 7
Fig. 7
Knockout of Casr in chondrocytes blocks the expression of IGF-1 and IGF-1R and delays cell differentiation. (A) Immunohistochemical staining of IGF-1 and IGF-1R, depicted by brown DAB staining, in the proximal tibial growth plates from E18 to E19 Tam-Cart-KO and control mice. (B) In vitro knockout of IGF-1R was performed by infecting floxed IGF-1R-containing GPCs with Ad-Cre (Cre) or, as a control, Ad-Cont (Cont) viruses (16 PFU/cell). Expression of IGF-1R and Col(X) mRNAs was assessed by qPCR 72 hours postinfection. (C) Western blots were incubated with antisera against the β subunit of IGF-1R to confirm the knockdown of IGF-1R in GPCs infected with Ad-Cre (Cre) compared with that in Ad-Cont (Cont) viruses. (D) AR staining was performed and quantified by absorbance to assess mineralization in cultures infected with Ad-Cre (Cre) or Ad-Cont (Cont) viruses and grown in media containing 2.0 mM Ca2+ for 14 days (**P < 0.001; n = 3).

Comment in

References

    1. Brown EM. The calcium-sensing receptor: Physiology, pathophysiology and CaR-based therapeutics. Subcell Biochem. 2007;45:139–167. - PubMed
    1. Brown EM, MacLeod RJ. Extracellular calcium sensing and extracellular calcium signaling. Physiol Rev. 2001;81:239–297. - PubMed
    1. Chang W, Shoback D. Extracellular Ca2+-sensing receptors—an overview. Cell Calcium. 2004;35:183–196. - PubMed
    1. Brown EM, Bai M, Pollak M. Familial benign hypocalciuric hypercalcemia and other syndromes of altered responsiveness to extracellular calcium. In: Avioli LV, Krane SM, editors. Metabolic Bone Disease. Academic Press; New York: 1998. pp. 479–499.
    1. Dvorak MM, Siddiqua A, Ward DT, Carter DH, Dallas SL, Nemeth EF, Riccardi D. Physiological changes in extracellular calcium concentration directly control osteoblast function in the absence of calciotropic hormones. Proc Natl Acad Sci USA. 2004;101:5140–5145. - PMC - PubMed

Publication types

MeSH terms