. 2008:4:216.
doi: 10.1038/msb.2008.53. Epub 2008 Sep 2.

Models from experiments: combinatorial drug perturbations of cancer cells

Affiliations

Models from experiments: combinatorial drug perturbations of cancer cells

Sven Nelander et al. Mol Syst Biol. 2008.

Abstract

We present a novel method for deriving network models from molecular profiles of perturbed cellular systems. The network models aim to predict quantitative outcomes of combinatorial perturbations, such as drug pair treatments or multiple genetic alterations. Mathematically, we represent the system by a set of nodes, representing molecular concentrations or cellular processes, a perturbation vector and an interaction matrix. After perturbation, the system evolves in time according to differential equations with built-in nonlinearity, similar to Hopfield networks, capable of representing epistasis and saturation effects. For a particular set of experiments, we derive the interaction matrix by minimizing a composite error function, aiming at accuracy of prediction and simplicity of network structure. To evaluate the predictive potential of the method, we performed 21 drug pair treatment experiments in a human breast cancer cell line (MCF7) with observation of phospho-proteins and cell cycle markers. The best derived network model rediscovered known interactions and contained interesting predictions. Possible applications include the discovery of regulatory interactions, the design of targeted combination therapies and the engineering of molecular biological networks.


Figures
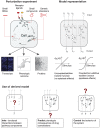
Figure 1
Figure 1
Combinatorial perturbation and multiple input–multiple output (MIMO) models. Upper left: intuitive view of perturbations and their points of action. Small inhibitory RNAs alter gene expression; natural protein ligands and small compounds act, e.g., on receptors, transporters or enzymes. Genetic alterations have diverse functional effects. Perturbations can be natural or investigational. Observations (readouts) typically focus on a phenotype of interest, such as growth or differentiation, and on observation points that are both practical and informative, such as transcripts, protein levels or covalent modifications, e.g. phosphorylation. Upper right: MIMO model. All key system variables are represented as real number variables, the combinatorial perturbations ui as well as their targets, internal variables, observation points and phenotypic outputs yi. Inputs (upper layer, squares) affect the different dynamical variables of the system (circles), some of which can be observed (lower layer, squares). The model represents a processing system that relates the input to the output through the interacting dynamical variables. Representation of coupled perturbations (nonlinear effects) is a key requirement of the modeling method. When rate equations are linear (lower left), perturbation effects will combine additively. However, in a well-parameterized system with nonlinear transfer functions (lower right), epistasis effects will arise, and downstream effects depend on pathway organization. Below: uses of a derived MIMO model. When inputs and outputs are known, a model can be used to infer the internal mechanism of the system (Interpretation). When the inputs and the system are known, the model can be used to predict a response (Prediction). When the system and the desired output are known, the model can serve to design optimal modes of control (Control).
Figure 2
Figure 2
Breast cancer cells as a multiple input–multiple output system. To generate data for model construction, we treated human MCF7 breast tumor cell lines with one natural ligand (epidermal growth factor (EGF)) and six inhibitors, singly and in combination. The treatment protocol used EGF, an IGF1 receptor inhibitory antibody (A12) and inhibitors of the signaling molecules EGFR, PI3K, mTOR, PKC-δ and MEK. The inhibitors are ZD1839, LY294002, rapamycin, rottlerin and PD0325901. In the perturbation matrix (top panel, columns=experiments, rows=perturbations), a blue box indicates the presence of a particular perturbation and white indicates absence. For each treatment, we used western blots to detect levels of the proteins phospho-AKT, phospho-ERK, phospho-MEK, phospho-eIF4E, phospho-c-RAF, phospho-p70S6K and phospho pS6. We used a FACS-based assay to quantify apoptosis (measured as the ‘sub-G1 fraction,' Materials and methods) and G1 arrest (measured as the G1 fraction). Here, representative flow histograms depicting cell cycle distribution in MCF7 cultures treated with or without drug are shown (one experiment is shown, see Supplementary information for all measurements). Evaluation of predictive power: After model construction based on these experiments, we see good agreement between experimental observation of the response of the MCF7 cell line to the 21 different perturbations (top, columns=experiments, rows=readouts) and the model prediction (bottom). Statistical assessment is in Supplementary Table 1. For each readout, we quantify the system's response by the phenotypic index defined as log relative response in treated versus untreated cells. For some drug combinations, the phenotypic readout increases as a result of perturbation (orange), for others it decreases (blue).
Figure 3
Figure 3
Use of MIMO models to infer regulatory interactions in breast cancer cells. The interaction matrix wij from a set of good models can be used to infer regulatory interactions (squares=inputs; circles=internal system variables and other observables). Positive wij means activation and negative wij means inhibition of the target. Interestingly, some of the interactions are well known in MCF7 cells (green arcs) and others constitute predictions (orange arcs). See Table I for functional comments on interactions. No underlying pathway model was used—the network is a straightforward interpretation of the optimized model parameters wij. The EGFR → MEK → ERK and PI3K → AKT, canonical pathways are identified. Also, note the detection of self-inhibitory interactions in MEK/ERK signaling, identification of eIF4E and AKT as direct regulators of apoptosis and G1 arrest.

References

    1. Avery L, Wasserman S (1992) Ordering gene function: the interpretation of epistasis in regulatory hierarchies. Trends Genet 8: 312–316 - PMC - PubMed
    1. Bonneau R, Reiss DJ, Shannon P, Facciotti M, Hood L, Baliga NS, Thorsson V (2006) The inferelator: an algorithm for learning parsimonious regulatory networks from systems-biology data sets de novo. Genome Biol 7: R36. - PMC - PubMed
    1. Borisy AA, Elliott PJ, Hurst N.W, Lee MS, Lehar J, Price ER, Serbedzija G, Zimmermann GR, Foley MA, Stockwell BR, Keith CT (2003) Systematic discovery of multicomponent therapeutics. Proc Natl Acad Sci USA 100: 7977–7982 - PMC - PubMed
    1. Chou TC (2006) Theoretical basis, experimental design, and computerized simulation of synergism and antagonism in drug combination studies. Pharmacol Rev 58: 621–681 - PubMed
    1. Culjkovic B, Topisirovic I, Skrabanek L, Ruiz-Gutierrez M, Borden KLB (2006) eif4e is a central node of an rna regulon that governs cellular proliferation. J Cell Biol 175: 415–426 - PMC - PubMed

Publication types

Substances