. 2008:4:217.
doi: 10.1038/msb.2008.54. Epub 2008 Sep 2.

A competitive complex formation mechanism underlies trichome patterning on Arabidopsis leaves

Affiliations

A competitive complex formation mechanism underlies trichome patterning on Arabidopsis leaves

Simona Digiuni et al. Mol Syst Biol. 2008.

Abstract

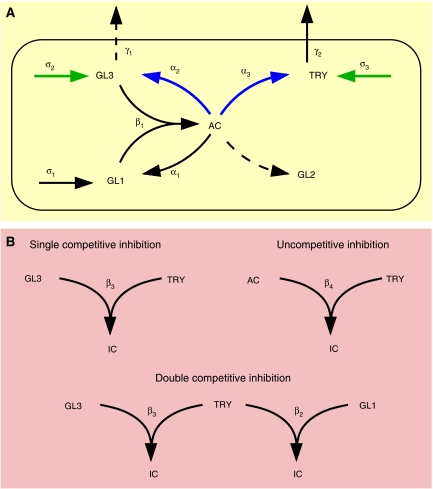
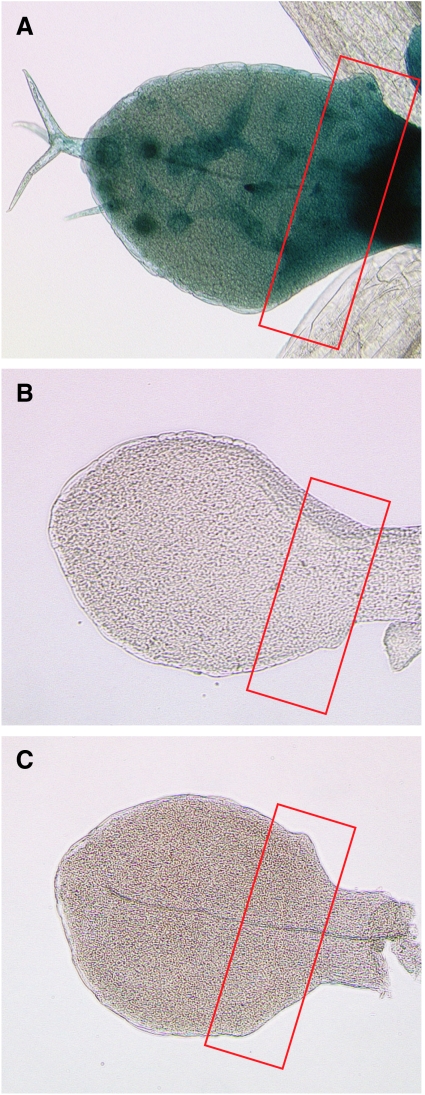
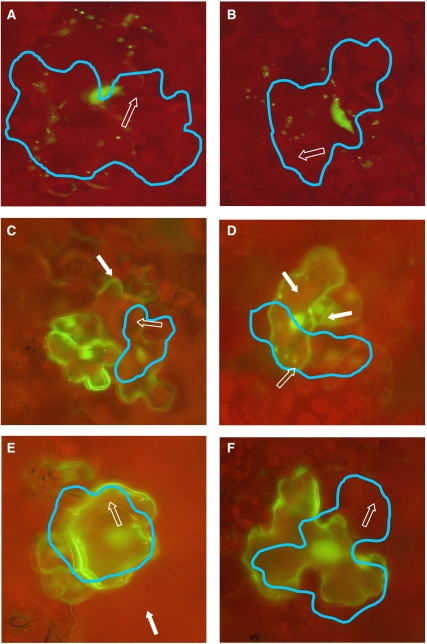
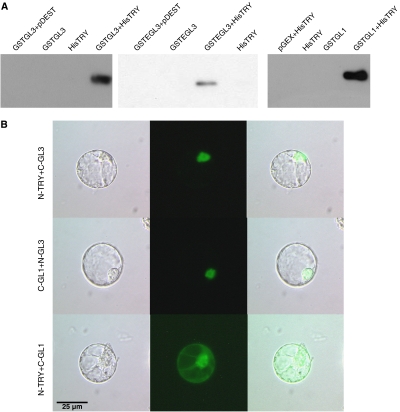
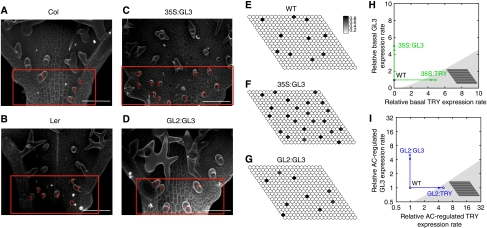
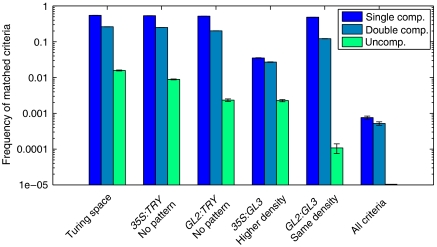
Trichome patterning in Arabidopsis serves as a model system for de novo pattern formation in plants. It is thought to typify the theoretical activator-inhibitor mechanism, although this hypothesis has never been challenged by a combined experimental and theoretical approach. By integrating the key genetic and molecular data of the trichome patterning system, we developed a new theoretical model that allows the direct testing of the effect of experimental interventions and in the prediction of patterning phenotypes. We show experimentally that the trichome inhibitor TRIPTYCHON is transcriptionally activated by the known positive regulators GLABRA1 and GLABRA3. Further, we demonstrate by particle bombardment of protein fusions with GFP that TRIPTYCHON and CAPRICE but not GLABRA1 and GLABRA3 can move between cells. Finally, theoretical considerations suggest promoter swapping and basal overexpression experiments by means of which we are able to discriminate three biologically meaningful variants of the trichome patterning model. Our study demonstrates that the mutual interplay between theory and experiment can reveal a new level of understanding of how biochemical mechanisms can drive biological patterning processes.


Figures

Figure 1
Figure 1
Mathematical modelling. (A) Activation part of the trichome patterning model. Solid lines indicate processes that are contained in the final model, whereas dashed lines indicate hypotheses that are rejected during the analysis. Greek letters denote the corresponding rate constants. The active complex (AC) induces the expression of the patterning genes GLABRA1 (GL1), GLABRA2 (GL2), GLABRA3 (GL3) and TRIPTYCHON (TRY). GL1 and GL3 form the active complex by dimerization. GL1, GL3 and TRY are basally expressed, and GL3 and TRY are non-cell autonomous. Basal and AC-regulated expression (green and blue arrows) denote processes that are manipulated in the simulations and experiments. (B) Inhibition part of the trichome patterning model. The three inhibition scenarios characterize how TRY may inhibit the positive feedback described in (A). In the cases of single competitive inhibition, TRY prevents the formation of the active complex by binding to free GL3, whereas in the double competitive inhibition TRY binds additionally to free GL1. In case of uncompetitive inhibition, TRY directly binds to the existing active complex. In all scenarios, the resulting inactive complex is denoted by IC. The full model comprises the interactions shown in (A) and one of the inhibitions given in (B).
Figure 2
Figure 2
Expression of TRY:GUS in wild type and mutants. TRY:GUS expression is shown in young leaves: (A) wild type; (B) gl3 and (C) gl1-1. Note that the ubiquitous expression at the leaf base is absent in all single mutants.
Figure 3
Figure 3
Intercellular mobility of proteins involved in trichome patterning. Translational fusions of GL1, GL3, TRY and CPC under the control of the 35S promoter (35S:GFP:GL1, 35S:GFP:GL3, 35S:GFP:TRY and 35S:GFP:CPC) are co-bombarded with 35S:YFP:peroxisome into Arabidopsis cotyledons and rosette leaves by the micro-projectile bombardment method and analysed after 6–10 h. Cells expressing fluorescent-labelled peroxisomes are highlighted by a blue line. One peroxisome in the initially transformed cell is indicated by an open arrow. A cell showing fluorescence in the immediate neighbourhood is marked with a white arrow. (A) GFP:GL1 and (B) GFP:GL3 fluorescence are seen only in the transformed cell. (C) GFP:TRY and (D) GFP:CPC fluorescence are found in neighbouring cells. (E) GFP alone is also found in neighbouring cells. (F) GFP:YFP is not mobile.
Figure 4
Figure 4
Molecular interactions of TRY with GL3, EGL3 and GL1. (A) The corresponding single protein fusions or combinations were purified by a GST pull down and detected on a western blot using an anti-His antibody. (B) BiFC was used to detect the interaction between TRY and GL1 or GL3 in protoplasts. Left lane shows a light micrograph, middle lane shows the BiFC fluorescence and the right micrograph shows the overlay.
Figure 5
Figure 5
Results of the experimental and simulated GL3 and TRY overexpressions. (AD) Scanning electron microscopy. The initiation zone is highlighted by a red box and red T's denote developing trichomes. The scale bar corresponds to 50 mm. (A) Columbia (Col) wild type. (B) Landsberg erecta (Ler) wild type. (C) 35S:GL3 overexpression results in a higher trichome density compared with the corresponding wild type ecotype Columbia. (D) GL2:GL3 overexpression results in a similar trichome density compared with the corresponding wild-type ecotype Landsberg erecta. (EG) Simulation results for the single competitive inhibition scenario. The relative level of the active complex AC is given in grey scale. High level indicates a future trichome. The parameter values are given in Materials and methods. (E) Wild type (WT). (F) 35S:GL3 overexpression. (G) GL2:GL3 overexpression. The change of the trichome density observed in the experiments is reflected in the simulations. (H, I) Two-dimensional sections of the parameter space. White area denotes the Turing space. The wild-type parameter set is indicated by the black circle and the corresponding simulated pattern is shown in (E). (H) Effect of 35S:GL3 and 35S:TRY overexpression in the single competitive scenario. The overexpression is simulated by increasing the rescaled basal expression rates k4 and k9 of GL3 and TRY, respectively. The 35S:TRY overexpression (right arrow) leads to a loss of trichome patterning (shaded area). Conversely, a five-fold 35S:GL3 overexpression relative to wild type level (top arrow) preserves the ability to form patterns (white area). The corresponding pattern is shown in (F). (I) Effect of GL2:GL3 and GL2:TRY overexpression in the single competitive scenario. The overexpression is simulated by five-fold increased AC-regulated expression rates k5 and k10 of GL3 and TRY, respectively. The corresponding pattern of five-fold GL2:GL3 overexpression is shown in (G).
Figure 6
Figure 6
Frequency of matched criteria for the three inhibition scenarios. The frequency of each criterion is determined from 106 random samples of the parameter space. The criteria reflect the agreement between the results of a model simulation and the experimentally observed phenotype in wild type and the four overexpression situations. Note the logarithmic scale of the y axis. Although the single and double competition scenarios fulfil all criteria within the same order of magnitude, the frequency of matches for the uncompetitive scenario is one order of magnitude lower than both other cases. Only the single and the double competition scenario, respectively, can match all criteria simultaneously. Mean and standard deviation of each criterion are determined from 10 blocks of 105 samples. For details of the criteria, see Materials and methods.

References

    1. Baudry A, Caboche M, Lepiniec L (2006) TT8 controls its own expression in a feedback regulation involving TTG1 and homologous MYB and bHLH factors, allowing a strong and cell-specific accumulation of flavonoids in Arabidopsis thaliana. Plant J 46: 768–779 - PubMed
    1. Berger F, Haseloff J, Schiefelbein J, Dolan L (1998) Positional information in root epidermis is defined during embryogenesis and acts in domains with strict boundaries. Curr Biol 8: 421–430 - PubMed
    1. Bernhardt C, Zhao M, Gonzalez A, Lloyd A, Schiefelbein J (2005) The bHLH genes GL3 and EGL3 participate in an intercellular regulatory circuit that controls cell patterning in the Arabidopsis root epidermis. Development 132: 291–298 - PubMed
    1. Clough S, Bent A (1998) Floral dip: a simplified method for Agrobacterium-mediated transformation of Arabidopsis thaliana. Plant J 16: 735–743 - PubMed
    1. Cooke J, Zeeman EC (1976) A clock and wavefront model for control of the number of repeated structures during animal morphogenesis. J Theor Biol 58: 455–476 - PubMed

Publication types

MeSH terms