Genome-scale model for Clostridium acetobutylicum: Part II. Development of specific proton flux states and numerically determined sub-systems
- PMID: 18767191
- PMCID: PMC2745297
- DOI: 10.1002/bit.22009
Genome-scale model for Clostridium acetobutylicum: Part II. Development of specific proton flux states and numerically determined sub-systems
Abstract
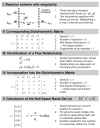
A regulated genome-scale model for Clostridium acetobutylicum ATCC 824 was developed based on its metabolic network reconstruction. To aid model convergence and limit the number of flux-vector possible solutions (the size of the phenotypic solution space), modeling strategies were developed to impose a new type of constraint at the endo-exo-metabolome interface. This constraint is termed the specific proton flux state, and its use enabled accurate prediction of the extracellular medium pH during vegetative growth of batch cultures. The specific proton flux refers to the influx or efflux of free protons (per unit biomass) across the cell membrane. A specific proton flux state encompasses a defined range of specific proton fluxes and includes all metabolic flux distributions resulting in a specific proton flux within this range. Effective simulation of time-course batch fermentation required the use of independent flux balance solutions from an optimum set of specific proton flux states. Using a real-coded genetic algorithm to optimize temporal bounds of specific proton flux states, we show that six separate specific proton flux states are required to model vegetative-growth metabolism and accurately predict the extracellular medium pH. Further, we define the apparent proton flux stoichiometry per weak acids efflux and show that this value decreases from approximately 3.5 mol of protons secreted per mole of weak acids at the start of the culture to approximately 0 at the end of vegetative growth. Calculations revealed that when specific weak acids production is maximized in vegetative growth, the net proton exchange between the cell and environment occurs primarily through weak acids efflux (apparent proton flux stoichiometry is 1). However, proton efflux through cation channels during the early stages of acidogenesis was found to be significant. We have also developed the concept of numerically determined sub-systems of genome-scale metabolic networks here as a sub-network with a one-dimensional null space basis set. A numerically determined sub-system was constructed in the genome-scale metabolic network to study the flux magnitudes and directions of acetylornithine transaminase, alanine racemase, and D-alanine transaminase. These results were then used to establish additional constraints for the genome-scale model.
Figures


Similar articles
-
Genome-scale model for Clostridium acetobutylicum: Part I. Metabolic network resolution and analysis.Biotechnol Bioeng. 2008 Dec 1;101(5):1036-52. doi: 10.1002/bit.22010. Biotechnol Bioeng. 2008. PMID: 18767192 Free PMC article.
-
Genome-scale reconstruction and in silico analysis of the Clostridium acetobutylicum ATCC 824 metabolic network.Appl Microbiol Biotechnol. 2008 Oct;80(5):849-62. doi: 10.1007/s00253-008-1654-4. Epub 2008 Aug 29. Appl Microbiol Biotechnol. 2008. PMID: 18758767
-
Genome-scale modeling using flux ratio constraints to enable metabolic engineering of clostridial metabolism in silico.BMC Syst Biol. 2012 May 14;6:42. doi: 10.1186/1752-0509-6-42. BMC Syst Biol. 2012. PMID: 22583864 Free PMC article.
-
From pre-culture to solvent: current trends in Clostridium acetobutylicum cultivation.Appl Microbiol Biotechnol. 2025 Feb 18;109(1):47. doi: 10.1007/s00253-025-13428-y. Appl Microbiol Biotechnol. 2025. PMID: 39964448 Free PMC article. Review.
-
An insight to flux-balance analysis for biochemical networks.Biotechnol Genet Eng Rev. 2020 Apr;36(1):32-55. doi: 10.1080/02648725.2020.1847440. Epub 2020 Dec 9. Biotechnol Genet Eng Rev. 2020. PMID: 33292061 Review.
Cited by
-
Applications of genome-scale metabolic reconstructions.Mol Syst Biol. 2009;5:320. doi: 10.1038/msb.2009.77. Epub 2009 Nov 3. Mol Syst Biol. 2009. PMID: 19888215 Free PMC article. Review.
-
Kinetic modeling of Stickland reactions-coupled methanogenesis for a methanogenic culture.AMB Express. 2019 Jun 10;9(1):82. doi: 10.1186/s13568-019-0803-8. AMB Express. 2019. PMID: 31183623 Free PMC article.
-
Amino acid catabolism-directed biofuel production in Clostridium sticklandii: An insight into model-driven systems engineering.Biotechnol Rep (Amst). 2017 Nov 8;16:32-43. doi: 10.1016/j.btre.2017.11.002. eCollection 2017 Dec. Biotechnol Rep (Amst). 2017. PMID: 29167757 Free PMC article. Review.
-
A Quantitative System-Scale Characterization of the Metabolism of Clostridium acetobutylicum.mBio. 2015 Nov 24;6(6):e01808-15. doi: 10.1128/mBio.01808-15. mBio. 2015. PMID: 26604256 Free PMC article.
-
Development of a core Clostridium thermocellum kinetic metabolic model consistent with multiple genetic perturbations.Biotechnol Biofuels. 2017 May 2;10:108. doi: 10.1186/s13068-017-0792-2. eCollection 2017. Biotechnol Biofuels. 2017. PMID: 28469704 Free PMC article.
References
Publication types
MeSH terms
Substances
Grants and funding
LinkOut - more resources
Full Text Sources
Molecular Biology Databases

