Pak1 regulates multiple c-Kit mediated Ras-MAPK gain-in-function phenotypes in Nf1+/- mast cells
- PMID: 18768391
- PMCID: PMC2597131
- DOI: 10.1182/blood-2008-04-155085
Pak1 regulates multiple c-Kit mediated Ras-MAPK gain-in-function phenotypes in Nf1+/- mast cells
Abstract
Neurofibromatosis type 1 (NF1) is a common genetic disorder caused by mutations in the NF1 locus, which encodes neurofibromin, a negative regulator of Ras. Patients with NF1 develop numerous neurofibromas, which contain many inflammatory mast cells that contribute to tumor formation. Subsequent to c-Kit stimulation, signaling from Ras to Rac1/2 to the MAPK pathway appears to be responsible for multiple hyperactive mast cell phenotypes; however, the specific effectors that mediate these functions remain uncertain. p21-activated kinase 1 (Pak1) is a downstream mediator of Rac1/2 that has been implicated as a positive regulator of MAPK pathway members and is a modulator of cell growth and cytoskeletal dynamics. Using an intercross of Pak 1(-/-) mice with Nf1(+/-) mice, we determined that Pak1 regulates hyperactive Ras-dependent proliferation via a Pak1/Erk pathway, whereas a Pak1/p38 pathway is required for the increased migration in Nf1(+/-) mast cells. Furthermore, we confirmed that loss of Pak1 corrects the dermal accumulation of Nf1(+/-) mast cells in vivo to levels found in wild-type mice. Thus, Pak1 is a novel mast cell mediator that functions as a key node in the MAPK signaling network and potential therapeutic target in NF1 patients.
Figures


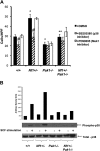
 ), or 10 μM of selective Mek1 inhibitor PD98059 (□). Cells were then stimulated with 25 ng of SCF for 72 hours, and viable cells were measured by trypan blue exclusion. Results are expressed as percentage of input number of cells at 72 hours after stimulation. Each value represents the mean, and the error bars represent the SEM of 6 independent experiments. *P < .05 compared with WT control. **P < .05 compared with Nf1+/− control. #P < .05 compared with DMSO treated cells within a genotype using Student unpaired t test. (B-D) Mast cells were serum starved overnight, stimulated with SCF, and cell lysates isolated at 0 and 2 minutes after stimulation. A total of 100 μg of protein was used for each time point. Levels of active Erk1 (B) and Mek1 (C,D) were determined by Western blotting using phospho-specific antibodies. Levels of total Erk1 and Mek1 are shown as loading controls. Western blot of the results is shown and is a representative of 3 independent experiments. Vertical lines in panel D have been inserted to indicate repositioned gel lanes for consistency with other blots.
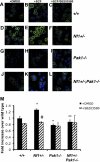
 ), or 10 μM of selective Mek1 inhibitor PD98059 (□). Cells were then stimulated with 25 ng of SCF in the lower chamber for 4 hours, and mast cells that had migrated to the bottom surface of the CH296-coated membrane in response to SCF were counted after staining the cells with crystal violet. Results are expressed as cells per 20× high-power field. Each value represents the mean; error bars represent the SEM of 6 independent experiments. *P < .05 compared with WT control. **P < .05 compared with Nf1+/− control. #P < .05 compared with DMSO-treated cells within a genotype using Student unpaired t test. (B) Mast cells were serum starved overnight, stimulated with SCF, and cell lysates isolated at 0 and 5 minutes after stimulation. A total of 100 μg of protein was used for each time point. Levels of active p38 were determined by Western blotting using phospho-specific antibodies. Level of total p38 is shown as a loading control. Western blot of the results is shown and is representative of 3 independent experiments.


References
-
- Gutmann DH, Collins FS. The neurofibromatosis type 1 gene and its protein product, neurofibromin. Neuron. 1993;10:335–343. - PubMed
-
- Xu GF, O'Connell P, Viskochil D, et al. The neurofibromatosis type 1 gene encodes a protein related to GAP. Cell. 1990;62:599–608. - PubMed
-
- DeClue JE, Papageorge AG, Fletcher JA, et al. Abnormal regulation of mammalian p21 ras contributes to malignant tumor growth in von Recklinghausen (Type 1) neurofibromatosis. Cell. 1992;69:265–273. - PubMed
-
- Riccardi VM. Neurofibromatosis: Phenotype, Natural History and Pathogenesis. 2nd ed. Baltimore, MD: John Hopkins University Press; 1992.
-
- Hirota S, Nomura S, Asada H, Ito A, Morii E, Kitamura Y. Possible involvement of c-kit receptor and its ligand in increase of mast cells in neurofibroma tissues. Arch Pathol Lab Med. 1993;117:996–999. - PubMed
Publication types
MeSH terms
Substances
Grants and funding
LinkOut - more resources
Full Text Sources
Molecular Biology Databases
Research Materials
Miscellaneous

