. 2008 Oct 31;283(44):30151-63.
doi: 10.1074/jbc.M802529200. Epub 2008 Sep 3.

Benzyl isothiocyanate targets mitochondrial respiratory chain to trigger reactive oxygen species-dependent apoptosis in human breast cancer cells

Affiliations

Benzyl isothiocyanate targets mitochondrial respiratory chain to trigger reactive oxygen species-dependent apoptosis in human breast cancer cells

Dong Xiao et al. J Biol Chem. .

Abstract

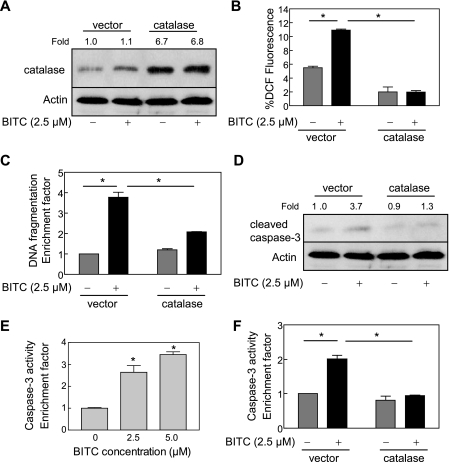
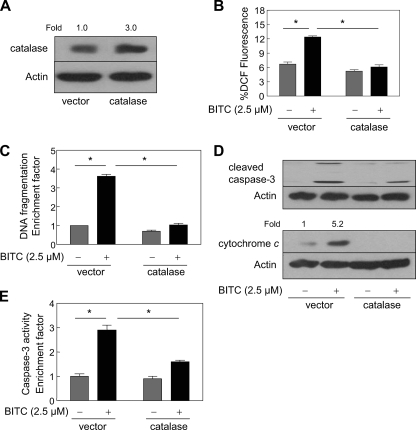
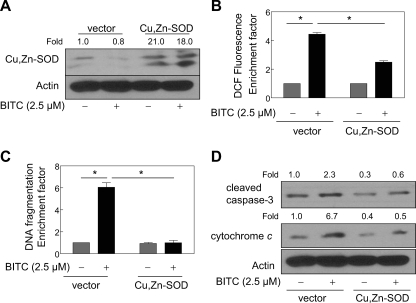
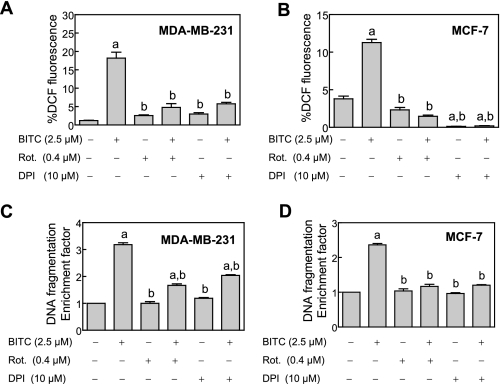
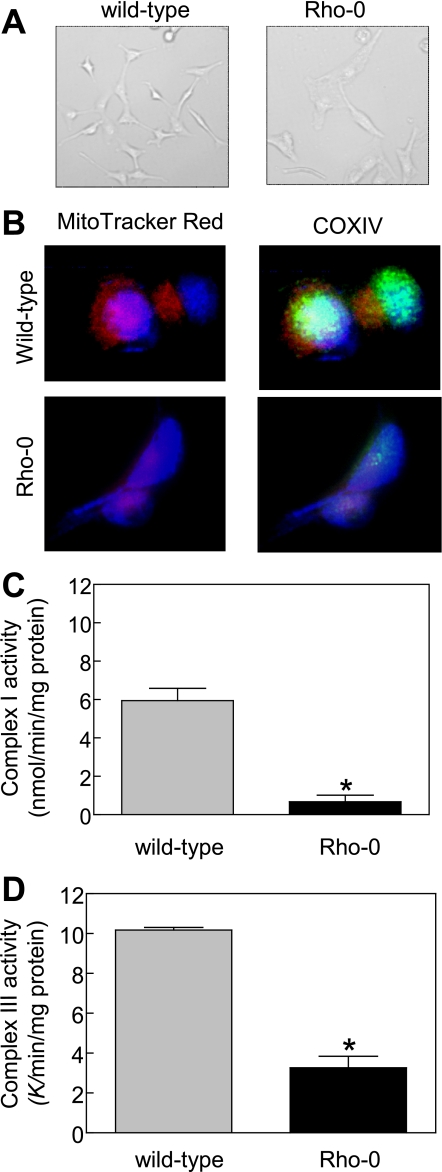
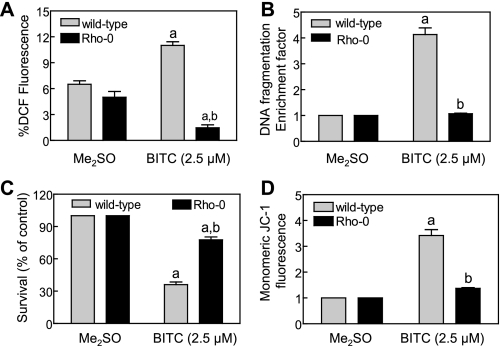
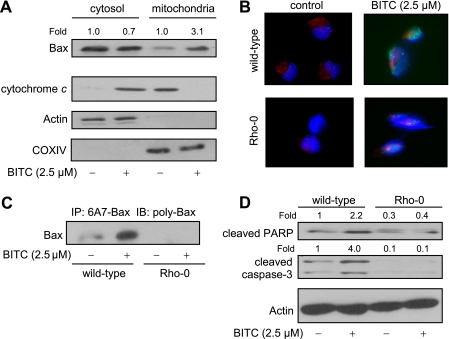
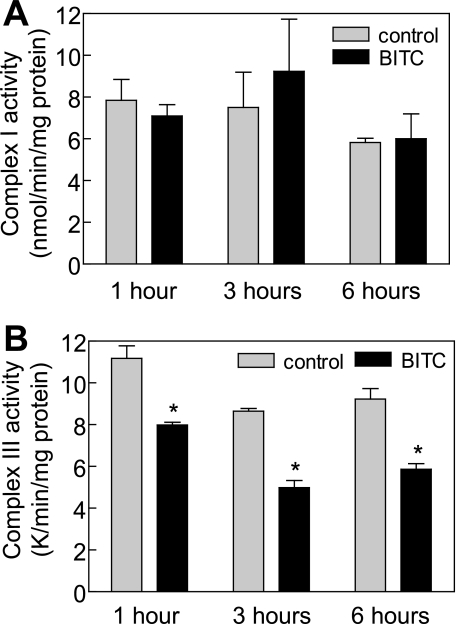
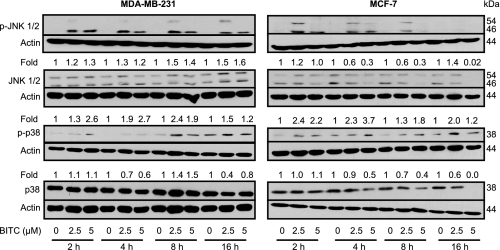
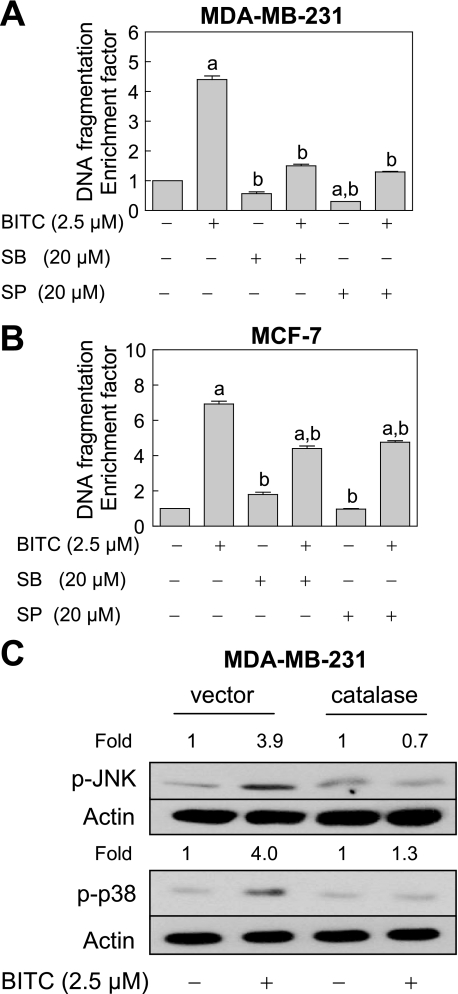
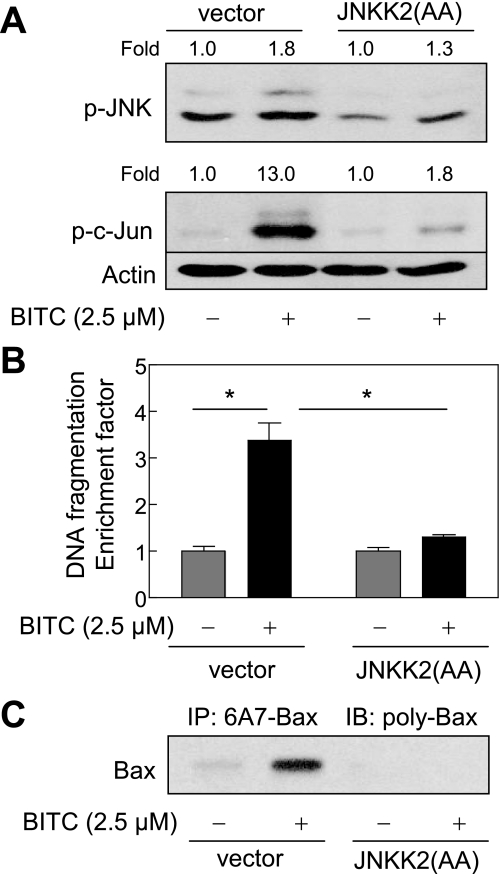
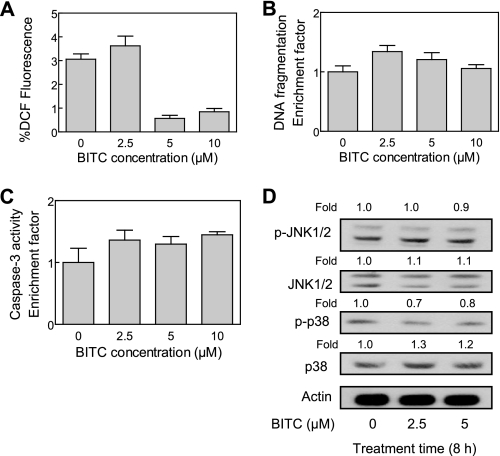
Benzyl isothiocyanate (BITC), a dietary cancer chemopreventive agent, causes apoptosis in MDA-MB-231 and MCF-7 human breast cancer cells, but the mechanism of cell death is not fully understood. We now demonstrate that the BITC-induced apoptosis in human breast cancer cells is initiated by reactive oxygen species (ROS) due to inhibition of complex III of the mitochondrial respiratory chain. The BITC-induced ROS production and apoptosis were significantly inhibited by overexpression of catalase and Cu,Zn-superoxide dismutase and pharmacological inhibition of the mitochondrial respiratory chain. The mitochondrial DNA-deficient Rho-0 variant of MDA-MB-231 cells was nearly completely resistant to BITC-mediated ROS generation and apoptosis. The Rho-0 MDA-MB-231 cells also resisted BITC-mediated mitochondrial translocation (activation) of Bax. Biochemical assays revealed inhibition of complex III activity in BITC-treated MDA-MB-231 cells as early as at 1 h of treatment. The BITC treatment caused activation of c-Jun N-terminal kinase (JNK) and p38 mitogen-activated protein kinase (MAPK), which function upstream of Bax activation in apoptotic response to various stimuli. Pharmacological inhibition of both JNK and p38 MAPK conferred partial yet significant protection against BITC-induced apoptosis. Activation of JNK and p38 MAPK resulting from BITC exposure was abolished by overexpression of catalase. The BITC-mediated conformational change of Bax was markedly suppressed by ectopic expression of catalytically inactive mutant of JNK kinase 2 (JNKK2(AA)). Interestingly, a normal human mammary epithelial cell line was resistant to BITC-mediated ROS generation, JNK/p38 MAPK activation, and apoptosis. In conclusion, the present study indicates that the BITC-induced apoptosis in human breast cancer cells is initiated by mitochondria-derived ROS.


Figures

FIGURE 1.
FIGURE 1.
Ectopic expression of catalase conferred protection against BITC-mediated ROS generation and apoptosis in MDA-MB-231 cells. A, immunoblotting for catalase using lysates from MDA-MB-231 cells transiently transfected with the empty pcDNA3.1 vector or pcDNA3.1 vector encoding catalase and treated for 24 h with Me2SO (control) or 2.5 μm BITC. The blot was stripped and reprobed with anti-actin antibody to ensure equal protein loading. The numbers above the immunoreactive bands represent change in protein levels relative to empty vector-transfected control cells treated with Me2SO (first lane). B, DCF fluorescence (ROS generation). C, cytoplasmic histone-associated DNA fragmentation (results are expressed as enrichment factor relative to Me2SO-treated empty vector-transfected cells). D, cleavage of procaspase-3 in MDA-MB-231 cells transiently transfected with the empty vector or catalase plasmid and treated for 2 h (B) or 24 h (C and D) with Me2SO (control) or 2.5 μm BITC. In D, the numbers above the immunoreactive bands represent change in protein level relative to empty vector-transfected control cells treated with Me2SO (first lane). E, flow cytometric analysis of caspase-3 activation in untransfected MDA-MB-231 cells treated for 16 h with Me2SO (control) or the indicated concentrations of BITC. Results are expressed as enrichment factor relative to Me2SO-treated control. F, flow cytometric analysis of caspase-3 activation in MDA-MB-231 cells transiently transfected with the empty vector or catalase plasmid and treated for 24 h with Me2SO (control) or 2.5 μm BITC. Results are expressed as enrichment factor relative to empty vector-transfected cells treated with Me2SO. Results in B, C, E, and F are mean ± S.E. (n = 3). *, significantly different (p < 0.05) between the indicated groups by one-way ANOVA followed by Dunnett's (E) or Bonferroni's multiple comparison test (B, C, and F). Experiments were performed three times independently with triplicate measurements in each experiment. Similar results were observed in three independent experiments. Representative data from a single experiment are shown.
FIGURE 2.
FIGURE 2.
The BITC-mediated ROS generation and apoptosis induction was inhibited by overexpression of catalase in MCF-7 cells. A, immunoblotting for catalase using lysates from MCF-7 cells transiently transfected with the empty pcDNA3.1 vector or vector encoding catalase. The blot was stripped and reprobed with anti-actin antibody to ensure equal protein loading. Change in protein level relative to empty vector-transfected MCF-7 cells is shown above the immunoreactive band. B, DCF fluorescence (ROS generation); C, cytoplasmic histone-associated DNA fragmentation; D, cleavage of procaspase-3 and cytosolic release of cytochrome c; E, activation of caspase-3 in MCF-7 cells transiently transfected with the empty vector or catalase plasmid and treated for 2 h (B) or 24 h (C–E) with Me2SO (control) or 2.5 μm BITC. Results in C and E are expressed as enrichment factor relative to empty vector-transfected cells treated with Me2SO. Results are mean ± S.E. (n = 3). *, significantly different (p < 0.05) between the indicated groups by one-way ANOVA followed by Bonferroni's multiple comparison test. D, the numbers above the immunoreactive bands represent change in protein levels relative to empty vector-transfected control cells treated with Me2SO. Quantitative results are not shown for cleaved caspase-3, because the band was not detected in empty vector-transfected cells treated with Me2SO. Experiments were performed three times independently with triplicate measurements in each experiment. Similar results were observed in three independent experiments. Representative data from a single experiment are shown.
FIGURE 3.
FIGURE 3.
Ectopic expression of Cu,Zn-SOD protected against BITC-mediated ROS generation and apoptosis in MDA-MB-231 cells. A, immunoblotting for Cu,Zn-SOD using lysates from MDA-MB-231 cells transiently transfected with the empty pcDNA3.1 vector or pcDNA3.1 vector encoding Cu,Zn-SOD and treated for 24 h with Me2SO (control) or 2.5 μm BITC. The blot was stripped and reprobed with anti-actin antibody to ensure equal protein loading. The numbers above the immunoreactive bands represent change in protein levels relative to empty vector-transfected cells treated with Me2SO. B, DCF fluorescence (ROS generation); C, cytoplasmic histone-associated DNA fragmentation; D, cleavage of procaspase-3 and cytosolic release of cytochrome c in MDA-MB-231 cells transiently transfected with the empty pcDNA3.1 vector or Cu,Zn-SOD plasmid and treated for 2 h (B) or 24 h (C and D) with Me2SO (control) or 2.5 μm BITC. In B and C, results are mean ± S.E. (n = 3). *, significantly different (p < 0.05) between the indicated groups by one-way ANOVA followed by Bonferroni's multiple comparison test. Experiments were repeated twice with triplicate measurements in each experiment. The results were consistent, and representative data from a single experiment are shown.
FIGURE 4.
FIGURE 4.
The BITC-mediated ROS generation and apoptosis induction was inhibited in the presence of inhibitors of MRC. Effect of pretreatment with rotenone and DPI on BITC-mediated ROS generation in MDA-MB-231 cells (A) and MCF-7 cells (B) and cytoplasmic histone-associated DNA fragmentation in MDA-MB-231 cells (C) and MCF-7 cells (D). The cells were pretreated for 1–2 h with either Me2SO (control), 0.4 μm rotenone, or 10 μm DPI. The cells were then either left untreated (Me2SO, rotenone, and DPI alone control groups) or exposed to 2.5 μm BITC for 1–2 h for analysis of ROS generation and 16–24 h for analysis of cytoplasmic histone-associated DNA fragmentation. Results are mean ± S.E. (n = 3); significantly different (p < 0.05) compared with Me2SO-treated control (a) and BITC alone treatment group (b) by one-way ANOVA followed by Tukey's test. Experiments were performed twice independently with triplicate measurements in each experiment. The results were consistent, and representative data from a single experiment are shown.
FIGURE 5.
FIGURE 5.
Characterization of Rho-0 variant of MDA-MB-231 cell line. A, morphology of wild-type and Rho-0 MDA-MB-231 cells visualized by microscopy. B, fluorescence microscopic analysis of mitochondrial and COXIV staining. The staining for MitoTracker red, COXIV, and nuclei are indicated by red, green, and blue fluorescence, respectively. C, activity of complex I using lysate proteins from wild-type and Rho-0 MDA-MB-231 cells. D, activity of complex III using lysate proteins from wild-type and Rho-0 MDA-MB-231 cells. Results are mean ± S.E. of 3–5 determinations. *, significantly different (p < 0.05) compared with wild-type MDA-MB-231 cells by unpaired t test. Each experiment was repeated at least twice, and the results were consistent. Representative data from a single experiment are shown.
FIGURE 6.
FIGURE 6.
Rho-0 variant of MDA-MB-231 cell line was significantly more resistant to growth suppression and apoptosis induction by BITC compared with wild-type cells. A, analysis of DCF fluorescence (ROS generation) in wild-type and Rho-0 MDA-MB-231 cells following a 1-h treatment with Me2SO (control) or 2.5 μm BITC. B, analysis of cytoplasmic histone-associated DNA fragmentation in wild-type and Rho-0 MDA-MB-231 cells following 24-h treatment with Me2SO (control) or 2.5 μm BITC. C, trypan blue dye exclusion assay to assess cell viability in wild-type and Rho-0 MDA-MB-231 cells following a 24-h treatment with Me2SO (control) or 2.5 μm BITC. D, analysis of mitochondrial membrane potential (monomeric JC-1-associated green fluorescence) in wild-type and Rho-0 MDA-MB-231 cells following a 6-h treatment with Me2SO (control) or 2.5 μm BITC. Results are mean ± S.E. (n = 3); significantly different (p < 0.05) compared with corresponding Me2SO-treated control (a) and between BITC-treated wild-type and BITC-treated Rho-0 cells (b) by one-way ANOVA followed by Bonferroni's multiple comparison test. Each experiment was performed at least twice with triplicate measurements in each experiment. The results were consistent, and representative data from a single experiment are shown.
FIGURE 7.
FIGURE 7.
Rho-0 MDA-MB-231 was resistant to BITC-mediated conformational change and mitochondrial translocation of Bax. A, immunoblotting for Bax (using polyclonal anti-Bax antibody) and cytochrome c using cytosolic and mitochondrial fractions prepared from MDA-MB-231 cells treated for 16 h with Me2SO (control) or 2.5 μm BITC. The blots were stripped and reprobed with anti-actin and anti-COXIV antibodies to ensure equal protein loading as well as to rule out cross-contamination of cytosolic and mitochondrial fractions. B, immunocytochemical staining for Bax (Bax-associated green fluorescence), mitochondria (MitoTracker red-associated red fluorescence), and nuclei (DAPI-associated blue fluorescence) in wild-type and Rho-0 MDA-MB-231 cells following an 8-h treatment with Me2SO (control) or 2.5 μm BITC. C, analysis of conformational change of Bax using lysates from wild-type and Rho-0 MDA-MB-231 cells treated for 16 h with Me2SO (control) or 2.5 μm BITC. Bax protein was immunoprecipitated from equal amounts of lysate protein using anti-Bax monoclonal antibody 6A7, which recognizes activated Bax. Immunoprecipitated (IP) complexes were subjected to immunoblotting (IB) using polyclonal anti-Bax antibody. D, immunoblotting for cleaved PARP and cleaved caspase-3 using lysates from wild-type and Rho-0 MDA-MB-231 cells following treatment with Me2SO (control) or 2.5 μm BITC. The blots were stripped and reprobed with anti-actin antibody to ensure equal protein loading. The numbers above the immunoreactive bands represent change in protein levels relative to Me2SO-treated wild-type MDA-MB-231 cells. Each experiment was performed twice, and the results were comparable. Representative data from a single experiment are shown.
FIGURE 8.
FIGURE 8.
The BITC treatment inhibited complex III activity in MDA-MB-231 cells. Effect of BITC treatment on complex I-linked NADH ubiquinone oxidoreductase activity (A) and complex III-linked ubiquinol cytochrome c reductase activity (B) in MDA-MB-231 cells. The MDA-MB-231 cells were treated with either Me2SO (control) or 5 μm BITC for the indicated time periods. Results are mean ± S.E. (n = 3). *, significantly different (p < 0.05) compared with Me2SO-treated control by paired t test. Experiments were performed three times independently with triplicate measurements in each experiment. Comparable results were observed in each experiment. Representative data from a single experiment are shown.
FIGURE 9.
FIGURE 9.
The BITC treatment increased activating phosphorylations of JNK and p38 MAPK in MDA-MB-231 and MCF-7 cells. Immunoblotting for phospho-JNK, total JNK, phospho-p38 MAPK, and total p38 MAPK using lysates from MDA-MB-231 and MCF-7 cells treated with Me2SO (control) or 2.5 and 5 μm BITC for the indicated time periods. The blots were stripped and reprobed with anti-actin antibody to ensure equal protein loading. Immunoblotting for each protein was performed twice using independently prepared lysates, and the results were similar. Representative data from a single experiment are shown. -Fold change in phosphoprotein/total protein level relative to Me2SO-treated control at each time point is shown above the immunoreactive band. The quantitative results are not shown for phospho-JNK levels, because the immunoreactive band was not detectable in the Me2SO-treated controls.
FIGURE 10.
FIGURE 10.
The BITC-induced apoptosis was inhibited by pharmacological inhibition of JNK and p38 MAPK in MDA-MB-231 and MCF-7 cells. Shown is the effect of pharmacological inhibitors of JNK (SP600125) and p38 MAPK (SB202190) on BITC-induced cytoplasmic histone-associated DNA fragmentation in MDA-MB-231 cells (A) and MCF-7 cells (B). The cells were pretreated for 2 h with the indicated concentrations of the inhibitors and then exposed to 2. 5 μm BITC for 16 h. Results are mean ± S.E. (n = 3); significantly different (p < 0.05) compared with Me2SO-treated control (a) and BITC alone (b) treatment group by one-way ANOVA followed by Bonferroni's multiple comparison test. Experiments in each cell line were performed twice with triplicate measurements in each experiment. The results of the independent experiments were consistent, and representative data from a single experiment are shown. C, immunoblotting for phospho-JNK and phospho-p38 MAPK using lysates from MDA-MB-231 cells transiently transfected with the empty pcDNA3.1 vector or pcDNA3.1 vector encoding catalase and treated for 8 h with Me2SO (control) or 2.5 μm BITC. The blots were stripped and reprobed with anti-actin antibody to ensure equal protein loading. The numbers above the immunoreactive bands represent change in protein levels relative to corresponding Me2SO-treated control.
FIGURE 11.
FIGURE 11.
The BITC-induced conformational change of Bax was regulated by JNK signaling axis in MDA-MB-231 cells. A, immunoblotting for phospho-JNK and phospho-c-Jun using lysates from MDA-MB-231 cells transiently transfected with the empty pcDNA3.1 vector or pcDNA3.1 vector encoding a catalytically inactive mutant of JNKK2 (JNKK2(AA)) and treated for 8 h with Me2SO (control) or 2.5 μm BITC. The blots were stripped and reprobed with anti-actin antibody to ensure equal protein loading. The numbers above the immunoreactive bands represent change in protein levels relative to corresponding Me2SO-treated control. B, cytoplasmic histone-associated DNA fragmentation in MDA-MB-231 cells transiently transfected with the empty pcDNA3.1 vector or pcDNA3.1 vector encoding JNKK2(AA) and treated for 24 h with Me2SO (control) or 2.5 μm BITC. Results are mean ± S.E. (n = 3). *, significantly different (p < 0.05) between the indicated groups by one-way ANOVA followed by Bonferroni's multiple comparison test. C, analysis of conformational change of Bax using lysates from MDA-MB-231 cells transiently transfected with the empty pcDNA3.1 vector or pcDNA3.1 vector encoding JNKK2(AA) and treated for 8 h with Me2SO (control) or 2.5 μm BITC. Bax protein was immunoprecipitated from equal amounts of lysate proteins using anti-Bax 6A7 monoclonal antibody. The immunoprecipitated complexes were subjected to immunoblotting using anti-Bax polyclonal antibody. Each experiment was repeated twice with comparable results. Representative data from a single experiment are shown.
FIGURE 12.
FIGURE 12.
Normal human mammary epithelial cell line HMEC was resistant toward BITC-mediated cellular responses. Shown is the effect of BITC treatment on ROS production (6-h treatment) (A), cytoplasmic histone-associated DNA fragmentation (24-h treatment) (B), and activation of caspase-3 (16-h treatment) (C) in HMEC cells. Results are mean ± S.E. (n = 3). Each assay was performed twice independently with triplicate measurements in each experiment. The results were comparable, and representative data from a single experiment are shown. D, immunoblotting for phospho-JNK, total JNK, phospho-p38 MAPK, and total p38 MAPK using lysates from HMEC treated with Me2SO (control) or 2.5 and 5 μm BITC for 8 h. The blots were stripped and reprobed with anti-actin antibody to ensure equal protein loading. Immunoblotting for each protein was performed twice using independently prepared lysates, and the results were similar. Representative data from a single experiment are shown. -Fold change in phosphoprotein/total protein levels relative to Me2SO-treated control is shown above the immunoreactive band.

Similar articles

Cited by

References

    1. Jemal, A., Siegel, R., Ward, E., Murray, T., Xu, J., Smigal, C., and Thun, M. J. (2006) CA-Cancer J. Clin. 56 106-130 - PubMed
    1. Kelsey, J. L., Gammon, M. D., and John, E. M. (1993) Epidemiol. Rev. 15 36-47 - PubMed
    1. Hulka, B. S., and Stark, A. T. (1995) Lancet 346 883-887 - PubMed
    1. Hankinson, S. E., Willett, W. C., Manson, J. E., Colditz, G. A., Hunter, D. J., Spiegelman, D., Barbieri, R. L., and Speizer, F. E. (1998) J. Natl. Cancer Inst. 90 1292-1299 - PubMed
    1. Cauley, J. A., Lucas, F. L., Kuller, L. H., Stone, K., Browner, W., and Cummings, S. R. (1999) Ann. Intern. Med. 130 270-277 - PubMed

Publication types