. 2008 Sep 3;28(36):8934-44.
doi: 10.1523/JNEUROSCI.4030-07.2008.

Receptive field shift and shrinkage in macaque middle temporal area through attentional gain modulation

Affiliations

Receptive field shift and shrinkage in macaque middle temporal area through attentional gain modulation

Thilo Womelsdorf et al. J Neurosci. .

Abstract

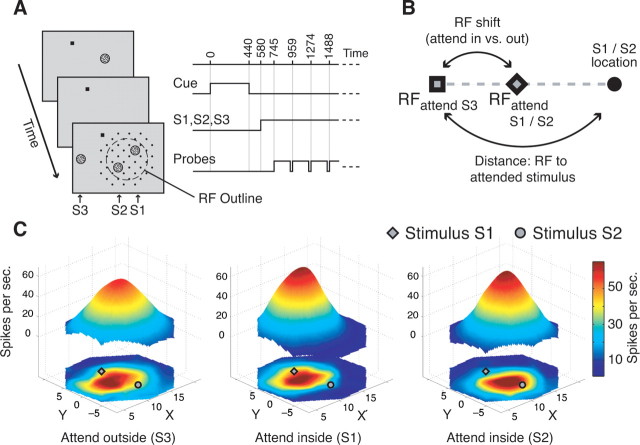
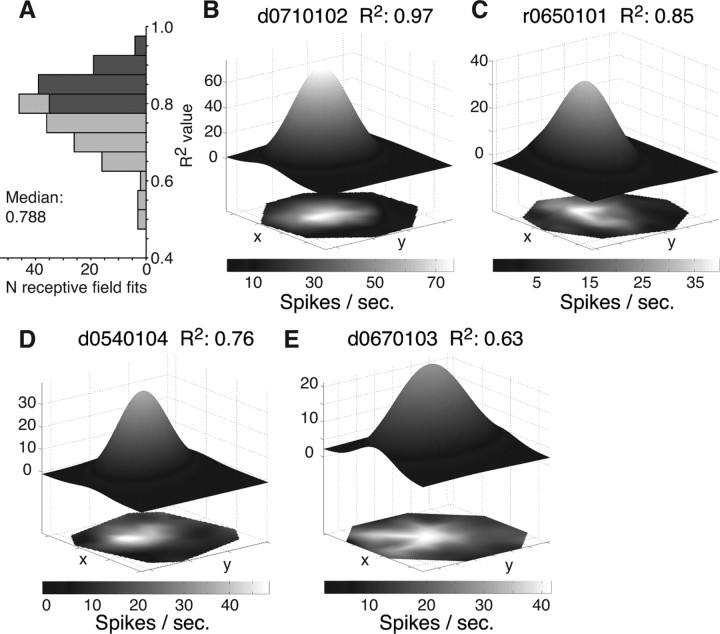
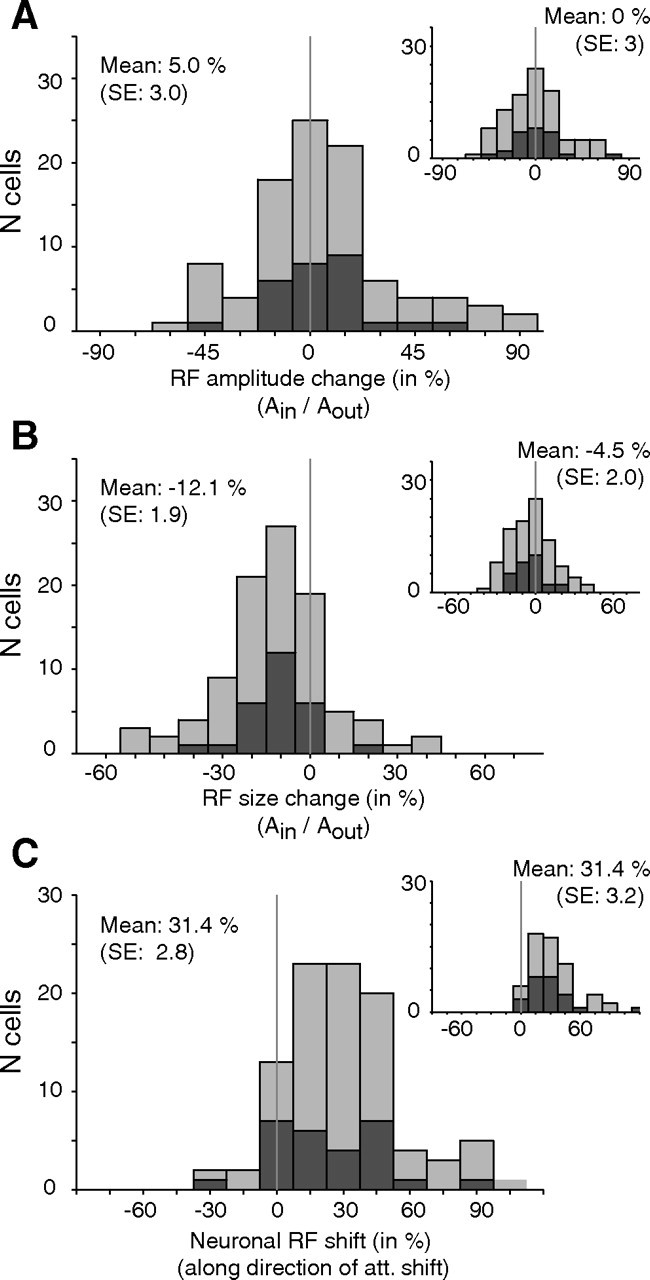
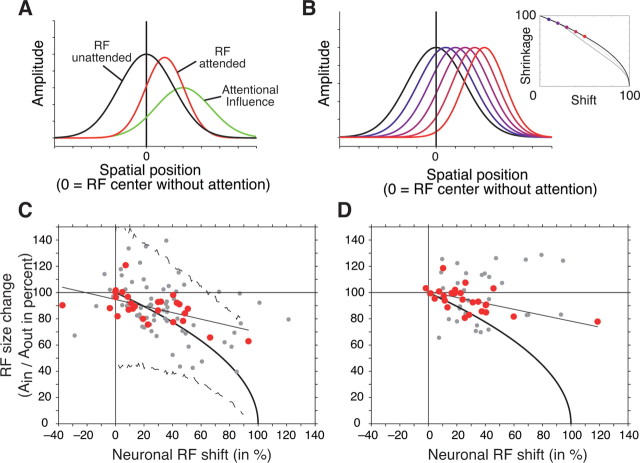
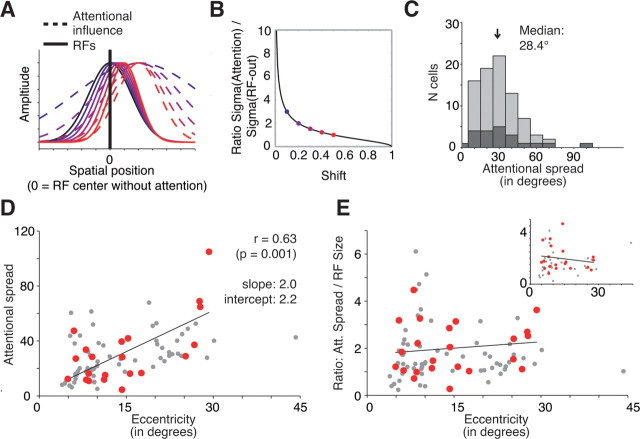
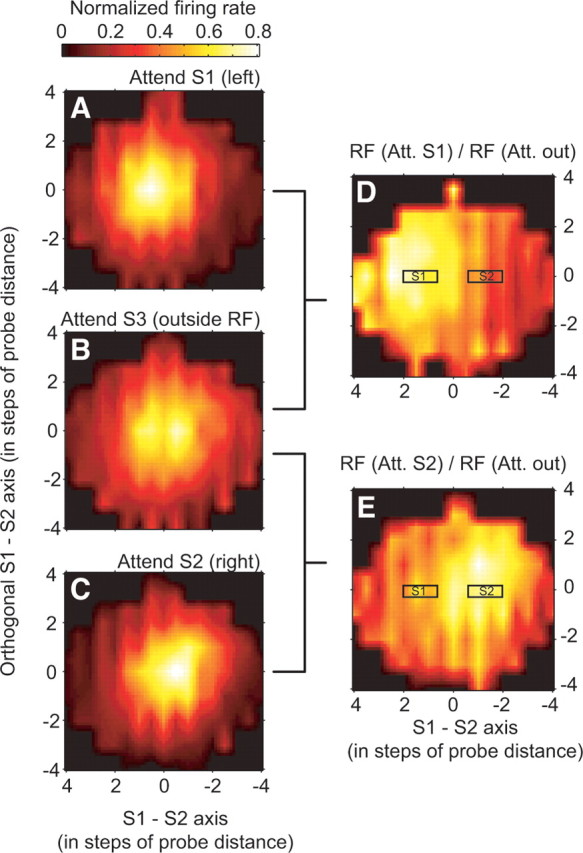
Selective attention is the top-down mechanism to allocate neuronal processing resources to the most relevant subset of the information provided by an organism's sensors. Attentional selection of a spatial location modulates the spatial-tuning characteristics (i.e., the receptive fields of neurons in macaque visual cortex). These tuning changes include a shift of receptive field centers toward the focus of attention and a narrowing of the receptive field when the attentional focus is directed into the receptive field. Here, we report that when attention is directed into versus of receptive fields of neurons in the middle temporal visual area (area MT), the magnitude of the shift of the spatial-tuning functions is positively correlated with a narrowing of spatial tuning around the attentional focus. By developing and applying a general attentional gain model, we show that these nonmultiplicative attentional modulations of basic neuronal-tuning characteristics could be a direct consequence of a spatially distributed multiplicative interaction of a bell-shaped attentional spotlight with the spatially fined-grained sensory inputs of MT neurons. Additionally, the model lets us estimate the spatial spread of the attentional top-down signal impinging on visual cortex. Consistent with psychophysical reports, the estimated size of the "spotlight of attention" indicates a coarse spatial resolution of attention. These results illustrate how spatially specific nonmultiplicative attentional changes of neuronal-tuning functions can be the result of multiplicative gain modulation affecting sensory neurons in a widely distributed region in cortical space.


Figures

Figure 1.
Figure 1.
Experimental protocol and illustration of receptive field maps. A, Experimental layout showing the succession of cue, target stimulus (S1, inside the receptive field outline; dashed circle), distractor stimuli (S2, inside receptive field; S3, outside receptive field), and the possible locations of the probe stimulus (black dots). B, Illustration of the calculation of receptive field shift (distance of the receptive fields in the attend outside and attend inside conditions) proportional to the distance of the receptive field (attend outside) to the attended stimulus position. C, Example receptive fields of a neuron while attention was directed outside the receptive field to S3 (left), inside the receptive field to stimulus S1 (middle), and to stimulus S2 (right). The bottom maps show spline-interpolated neuronal response profiles and the floating three-dimensional maps are the Gaussian fits used to describe the receptive field parameters. The example illustrates that responses to probes close to (far from) an attended stimulus in the receptive field were enhanced (reduced) compared with when attention was directed to S3.
Figure 2.
Figure 2.
Fitting MT receptive fields with a Gaussian profile. A, Distribution of R2 values of the Gaussian fits to individual receptive fields in the different attentional conditions. Bar coloring indicates fits with an above-median (dark gray) and below-median (light gray) R2 value. B–E, Examples of spline-interpolated (bottom, surfaces in two dimensions) and fitted (top, three-dimensional surfaces) receptive field profiles with an above-median R2 value (B, C) and a below-median R2 value (D, E).
Figure 3.
Figure 3.
Neuronal receptive field modulation with attention inside versus outside the RF for 97 RF pairs (in each panel, mean and SE are computed across all 97 RF pairs). The dark gray colored bars indicate “selected” RF pairs [i.e., those pairs in which both RFs were fitted with above-median R2 values (n = 27)]. A, Distribution of changes in RF amplitude between conditions (Gaussian-fitted RFs). The inset plot shows changes in amplitude (maximum response to the probe) extracted from the spline-interpolated RFs. B, Histogram of receptive field size changes with attention inside versus outside the receptive field. Values below zero indicate receptive field shrinkage. The inset shows the size changes when RF size is measured as the square root of the area above the one-half maximum response in the interpolated profile. C, Distribution of receptive field shifts parallel to the axis connecting the receptive field center when attention was directed to S3 and the target location in the paired condition when attention was directed into the receptive field (Fig. 1B, long arrow). Positive values signify shifts toward the attended stimulus inside the receptive field. The inset shows the RF shift distribution obtained from the nonparametric maps (with RF centers measured as the center of mass of the area at one-half-maximum response).
Figure 4.
Figure 4.
Illustration of model assumptions and the model's fit to the neuronal data. A, The model predicts that the spatial response profile of a neuronal receptive field (here as one-dimensional Gaussians) with attention outside the receptive field (RF unattended, black line) interacts multiplicatively with a Gaussian-shaped attentional influence (green line). Multiplying these two Gaussians results in a narrower receptive field which is shifted toward the center of attention (RF attended, red line). B, Illustration of the predicted relationship of the extent of neuronal receptive field shift and receptive field shrinkage (Eq. 7). The stronger the shift of neuronal receptive fields [blue to red (left to right) Gaussian receptive field profiles] the stronger the receptive field shrinkage following Equation 7 and shown in the inset (blue to red dots). The black line in the inset illustrates the predicted shift and shrinkage relationship according to Equation 7, assuming a Gaussian-shaped receptive field and a Gaussian-shaped attentional spotlight. Gray lines show the prediction under the assumption of a cosine-shaped attentional spotlight together with receptive fields shaped as Gaussian (dark gray) or cosine functions (light gray). C, Scatter plot of the observed receptive field shrinkage (y-axis; 100% represents no size change) and receptive field shift (x-axis) for 27 pairs of receptive fields in the attend-in versus attend-out conditions that could be fit with an R2 value above the median (red colored dots) and for the remaining 70 pairs (gray dots). The black line shows the linear regression, whereas the solid black curve indicates the relationship of receptive field shift and shrinkage predicted by the model. Dashed lines show the 99% confidence range expected for data points across all cells (based on the Monte Carlo simulation, see Materials and Methods). D, Same format as in C, but plotting the results based on the comparison of the nonparametric estimates of the receptive field center (center of mass) and size (square root area above one-half-maximum response).
Figure 5.
Figure 5.
Model prediction and estimation of attentional spread underlying the observed shift and shrinkage of neuronal receptive fields. A, Given a fixed spatial center of attention, the model estimates a narrower attentional spread (blue to red, dashed Gaussians) and the stronger the receptive field is shifted toward the attentional focus (blue to red, solid Gaussians). B, Relationship between the expected RF shrinkage (when attention is shifted into the RF) as a function of the observed RF shift (Eq. 8, see Materials and Methods). C, Distribution of the attentional spread (full width) estimated based on the observed RF shifts. Dark/light gray bars represent the data from the selected/all RF pairs as in Figures 2–4. D, Scatter plot showing that the estimated attentional spread (y-axis) grows with an increasing eccentricity of the attentional focus (x-axis). The best-fitting linear regression has the form width of attentional spread, 2.0 × eccentricity + 2.2. Red dots represent the data from selected RF pairs, and gray dots represent the data from all RF pairs as in Figures 2–4. E, Same format as in D, but showing the lack of correlation between the ratio of attentional spreads to RF size with eccentricity of the neuron's RF.
Figure 6.
Figure 6.
Average profiles of the nonparametric interpolated RF profiles of the three attentional conditions and derivation of an average, normalized attentional profile. A–C, Average RF when attention was directed to stimulus S1 inside the RF (A, to the left of 0/0), to stimulus S3 outside the RF (B), and to stimulus S2 inside the RF (C, to the right of 0/0). D, E, Average attentional effect illustrated as the ratio of the RF profiles of attend-S1-to-attend-S3 (D) and attend-S2-to-attend-S3 (E). The relative positions of stimulus S1 and S2 in the attentional maps are indicated by black rectangles (at positions of ±1, ±1.5, or 2 probe “steps” across cells, varying as a function of the chosen mapping grid for individual neuronal RFs). Maps were smoothed by linearly interpolation between adjacent data points in the plot.

References

    1. Andersen RA, Essick GK, Siegel RM. Encoding of spatial location by posterior parietal neurons. Science. 1985;230:456–458. - PubMed
    1. Ardid S, Wang XJ, Compte A. An integrated microcircuit model of attentional processing in the neocortex. J Neurosci. 2007;27:8486–8495. - PMC - PubMed
    1. Bichot NP, Rossi AF, Desimone R. Parallel and serial neural mechanisms for visual search in macaque area V4. Science. 2005;308:529–534. - PubMed
    1. Boynton GM. Attention and visual perception. Curr Opin Neurobiol. 2005;15:465–469. - PubMed
    1. Britten KH, Heuer HW. Spatial summation in the receptive fields of MT neurons. J Neurosci. 1999;19:5074–5084. - PMC - PubMed

Publication types

LinkOut - more resources