. 2008 Sep 9;105(36):13544-9.
doi: 10.1073/pnas.0800041105. Epub 2008 Sep 3.

Inhibition of the mTORC1 pathway suppresses intestinal polyp formation and reduces mortality in ApcDelta716 mice

Affiliations

Inhibition of the mTORC1 pathway suppresses intestinal polyp formation and reduces mortality in ApcDelta716 mice

Teruaki Fujishita et al. Proc Natl Acad Sci U S A. .

Abstract

The mammalian target of rapamycin (mTOR) is a serine/threonine kinase that regulates cell growth via mTOR complex 1 (mTORC1), whose activation has been implicated in many human cancers. However, mTORC1's status in gastrointestinal tumors has not been characterized thoroughly. We have found that the mTORC1 pathway is activated with increased expression of the mTOR protein in intestinal polyps of the Apc(Delta716) heterozygous mutant mouse, a model for human familial adenomatous polyposis. An 8-week treatment with RAD001 (everolimus) suppressed the mTORC1 activity in these polyps and inhibited proliferation of the adenoma cells as well as tumor angiogenesis, which significantly reduced not only the number of polyps but also their size. beta-Catenin knockdown in the colon cancer cell lines reduced the mTOR level and thereby inhibited the mTORC1 signaling. These results suggest that the Wnt signaling contributes to mTORC1 activation through the increased level of mTOR and that the activation plays important roles in the intestinal polyp formation and growth. Indeed, long-term RAD001 treatment significantly reduced mortality of the Apc(Delta716) mice. Thus, we propose that the mTOR inhibitors may be efficacious for therapy and prevention of colonic adenomas and cancers with Wnt signaling activation.


Conflict of interest statement

The authors declare no conflict of interest.

Figures

Fig. 1.
Fig. 1.
Activation of the mTOR signaling pathway in ApcΔ716 mouse polyps. (A) Western blot analysis of S6 phosphorylated at Ser-235/236 (p-S6) and total S6 in the normal ileal mucosa and polyps of the ApcΔ716 mouse. COX-2 is known to be expressed in the polyps, but little in the normal tissue, and served as a control for good preparation of the polyp sample. COX-1 was constitutively expressed in the normal tissues and polyps. (B and C) Immunostaining of p-S6 in intestinal polyp (B) and the normal ileum (C) of the ApcΔ716 mouse. (B Inset) Subfield at 4-fold higher magnification. (D) Western blot analysis of p-S6 in the normal ileal mucosa and polyps of the ApcΔ716 mouse treated with placebo or RAD001. Mice were orally treated with placebo (Pla) or RAD001 at 10 mg/kg [RAD(3d)] for 3 days. (E and F) Immunostaining of p-S6 in placebo- or RAD001-treated intestinal polyp of ApcΔ716 mouse, respectively. (Scale bars: B, 250 μm; C, E, and F, 200 μm.)
Fig. 2.
Fig. 2.
RAD001 suppresses polyp formation with significant effects on survival in the ApcΔ716 mouse. (A) Schematic diagram of the RAD001 treatment schedule. Mice were treated with RAD001 once a day for 8 weeks. (B) Number of polyps per mouse scored (B1), size distribution of the intestinal polyps (B2), and percent of the polyp number for each size (B3) in ApcΔ716 mice treated with RAD001. (C) Gross appearance of the small intestinal polyps. Arrowheads indicate Peyer's patch. Duo, duodenum, Jej: Jejunum; Ile, Ileum. (D) Dissection micrograph of the small intestine. (E) Cross-section of a polyp (shown in D) cut along the dotted line. H&E staining of placebo (Upper) and RAD001-treated polyps (Lower). (Scale bar: 200 μm.) (F) Kaplan–Meier plot shows survival in ApcΔ716 mice treated with placebo (n = 10, black); RAD001, 3 mg/kg (n = 9, red); and RAD001, 10 mg/kg (n = 10, blue).
Fig. 3.
Fig. 3.
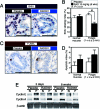
RAD001 attenuates adenoma cell growth but does not induce apoptosis. (A) Photographs of the small intestinal adenoma epithelium labeled with BrdU in placebo-treated (Left) and RAD001-treated (Right) ApcΔ716 mouse. (B) BrdU labeling indices of small intestinal normal mucosa and polyps in placebo-treated and RAD001-treated ApcΔ716 mice. (C) Photographs of TUNEL assay in small intestinal polyps in placebo-treated (Left) and RAD001-treated (Right) ApcΔ716 mouse. (D) Apoptotic indices of small intestinal normal mucosa and polyps in placebo- and RAD001-treated ApcΔ716 mice. (E) Western blot analysis of cyclin E and cyclin A in the normal ileum and polyps of the ApcΔ716 mouse treated with placebo or RAD001 (10 mg/kg) for 3 days or 8 weeks. (Scale bars: A and C, 50 μm.)
Fig. 4.
Fig. 4.
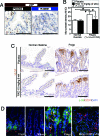
Treatment with RAD001 inhibits angiogenesis in the polyps of ApcΔ716 mouse. (A) Immunostaining of von Willebrand Factor (vWF) in the luminal side of a small intestinal polyp of placebo-treated (Left) and RAD001-treated (Right) ApcΔ716 mouse. (B) Microvessel density (MVD) in the placebo-treated and RAD001-treated ApcΔ716 mice. (C) Immunostaining of VEGF in the luminal side of a small intestinal polyp (Right) and the normal ileum (Left) of the placebo-treated (Upper) and RAD001-treated (Lower) ApcΔ716 mouse. (D) Immunofluorescence of p-S6 (green) and CD31 (red) in the normal crypt villus, and the luminal side of small intestinal polyp in the ApcΔ716 mouse and immunofluorescence in the luminal side of small intestinal polyp in the ApcΔ716 mouse treated with RAD001 for 1 week (Left to Right). Nuclei were stained with DAPI. White arrows indicate double-positive cells. (Scale bars: A and C, 50 μm.) (Magnification, D: crypt and villus, ×200; polyps, ×400.)
Fig. 5.
Fig. 5.
Wnt signaling positively regulates mTOR protein expression. (A) Western blot analysis of mTOR, p-S6, and S6 in the normal ileal mucosa (N) and polyps (P) of the ApcΔ716 mouse. β-Actin is shown as a loading control. (B) Western blot analysis of mTOR in SW480 cells treated with siRNA against β-catenin. Samples were prepared 72 h after transfection of 40 nM scramble RNA or 40 nM β-catenin siRNA (CTNNB1 siRNA-1). β-Catenin siRNA can drastically inhibit β-catenin expression. (C) Two siRNAs against β-catenin with different sequences, CTNNB1 siRNA-1 (40 nM) and CTNNB1 siRNA-2 (40 nM), were used for transfection. Samples were prepared 72 h after transfection. (D) Immunofluorescence of mTOR (Left) and β-catenin (Center) in SW480 cells treated with 40 nM scramble RNA (Upper) or siRNA against β-catenin (Lower). (Right) Merged images of mTOR (green) and β-catenin (red). Nuclei were stained by DAPI. (Magnification: ×400.)

References

    1. Wullschleger S, Loewith R, Hall MN. TOR signaling in growth and metabolism. Cell. 2006;124:471–484. - PubMed
    1. Sarbassov DD, Guertin DA, Ali SM, Sabatini DM. Phosphorylation and regulation of Akt/PKB by the rictor-mTOR complex. Science. 2005;307:1098–1101. - PubMed
    1. Jacinto E, et al. Mammalian TOR complex 2 controls the actin cytoskeleton and is rapamycin insensitive. Nat Cell Biol. 2004;6:1122–1128. - PubMed
    1. Bjornsti M-A, Houghton PJ. The TOR pathway: A target for cancer therapy. Nat Rev Cancer. 2004;4:335–348. - PubMed
    1. Majumder PK, et al. mTOR inhibition reverses Akt-dependent prostate intraepithelial neoplasia through regulation of apoptotic and HIF-1-dependent pathways. Nat Med. 2004;10:594–601. - PubMed

Publication types

MeSH terms