. 2008 Sep 3;3(9):e3114.
doi: 10.1371/journal.pone.0003114.

Development and Notch signaling requirements of the zebrafish choroid plexus

Affiliations

Development and Notch signaling requirements of the zebrafish choroid plexus

Brent R Bill et al. PLoS One. .

Abstract

Background: The choroid plexus (CP) is an epithelial and vascular structure in the ventricular system of the brain that is a critical part of the blood-brain barrier. The CP has two primary functions, 1) to produce and regulate components of the cerebral spinal fluid, and 2) to inhibit entry into the brain of exogenous substances. Despite its importance in neurobiology, little is known about how this structure forms.

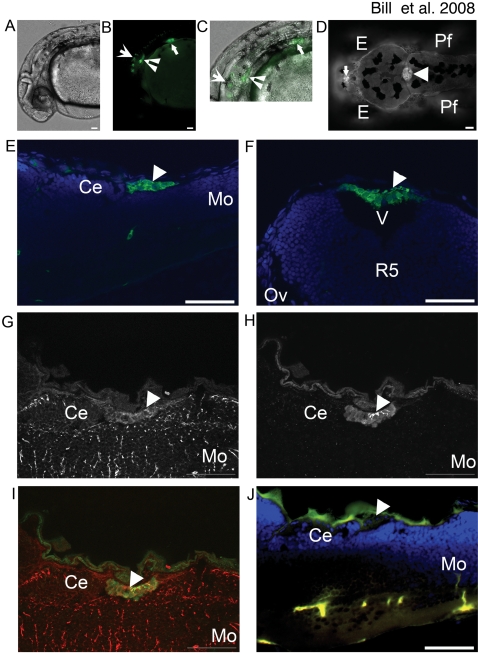
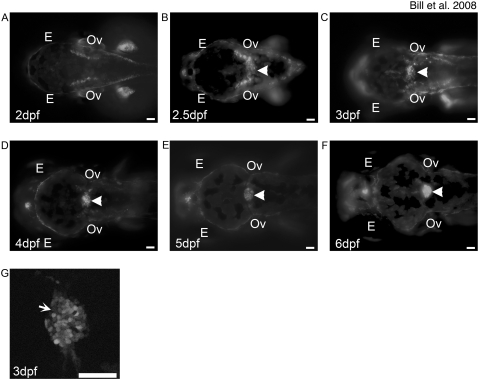
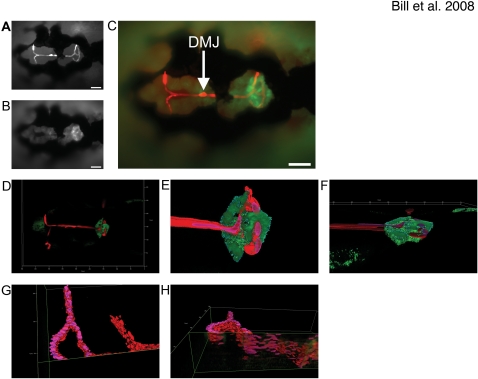
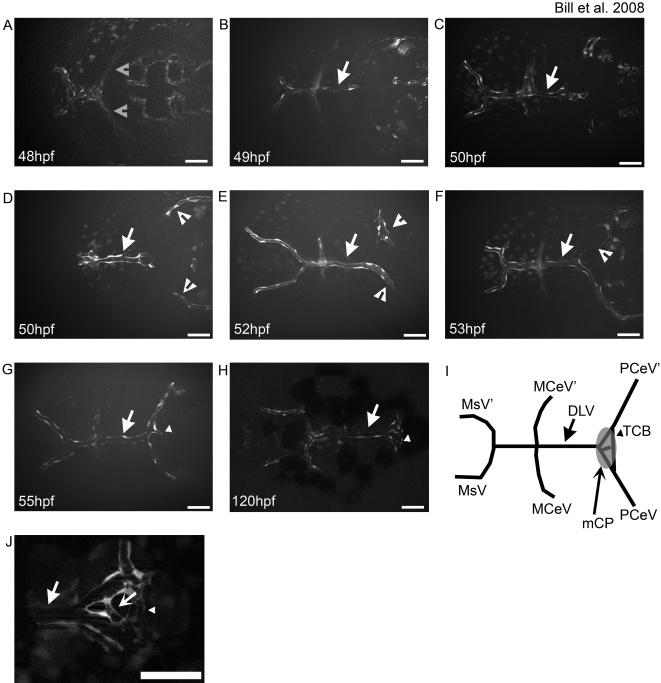
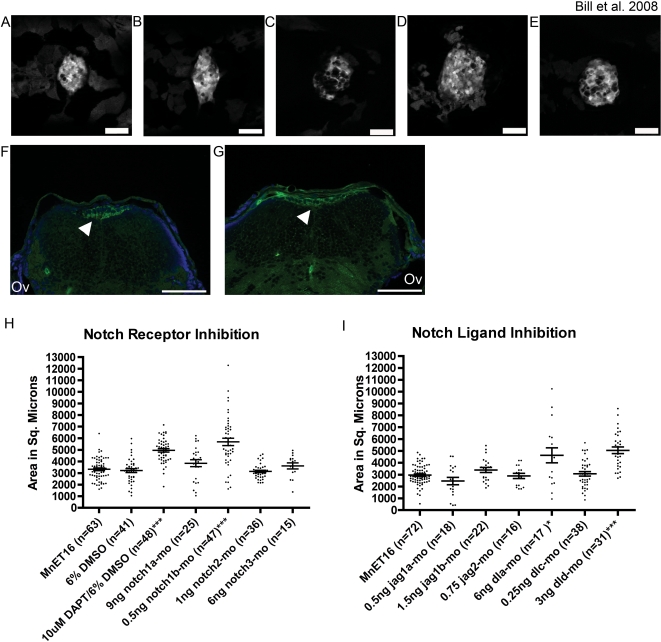
Methodology and principal findings: Here we show that the transposon-mediated enhancer trap zebrafish line Et(Mn16) expresses green fluorescent protein within a population of cells that migrate toward the midline and coalesce to form the definitive CP. We further demonstrate the development of the integral vascular network of the definitive CP. Utilizing pharmacologic pan-notch inhibition and specific morpholino-mediated knockdown, we demonstrate a requirement for Notch signaling in choroid plexus development. We identify three Notch signaling pathway members as mediating this effect, notch1b, deltaA, and deltaD.

Conclusions and significance: This work is the first to identify the zebrafish choroid plexus and to characterize its epithelial and vasculature integration. This study, in the context of other comparative anatomical studies, strongly indicates a conserved mechanism for development of the CP. Finally, we characterize a requirement for Notch signaling in the developing CP. This establishes the zebrafish CP as an important new system for the determination of key signaling pathways in the formation of this essential component of the vertebrate brain.


Conflict of interest statement

Competing Interests: The authors have declared that no competing interests exist.

Figures

Figure 1
Figure 1. EtMn16 co-localizes with Gfap in mCP epithelia.
GFP is expressed in multiple anatomical locations in EtMn16 larvae (A–D). At 30 hpf (A–C)(lateral orientation), GFP is expressed in cells of the otic vesicle (inverted arrowhead), the pectoral fin (closed arrow), ventral hindbrain and spinal cord (open arrow) brightfield image (A), fluorescent image (B), and merged image (C). In addition to cells of the ventral hindbrain, at 4 dpf (D)(dorsal orientation), two additional structures express GFP, the diencephalic CP (dCP) (closed arrow), and the myelencephalic CP (mCP) (closed arrowhead). The mCP lies posterior to the cerebellum (Ce) [(5 dpf, 6 µm longitudinal cryosection) (E)], within the ventricle (v) dorsal to the fifth rhombomere (r5)[5 dpf, 6 µm transverse cryosection (F)]. Cells of the mCP express Gfap (G) and colocalize with GFP expressing cells (H), merged image (I) and are not seen in the negative control lacking antibodies for Gfap and GFP (J). Abbreviations: eye (E), pectoral fin (Pf), cerebellum (Ce), and medulla oblongata (Mo). All images except F are oriented anterior to the left; F is oriented dorsal to the top. Scale bar is 50 µm.
Figure 2
Figure 2. Development of the mCP as defined by EtMn16 larvae.
Fluorescent images of dorsal-oriented live zebrafish taken at 2 dpf (A), 2.5 dpf (B), 3 dpf (C), 4 dpf (D), 5 dpf (E), and 6 dpf (F); arrowhead indicates mCP. GFP-expressing cells first appear diffusely across the roof plate of the fourth ventricle (B), as defined by the level of the otic vesicles (Ov). Cells migrate toward the midline and finish coalescence by 4 dpf. The expression in this structure remains static through 6 dpf. Not all cells of the mCP express GFP (G, arrow). In all images, anterior is to the left, and scale bar is 50 µm. Abbreviations: eye (E), otic vesicle (Ov).
Figure 3
Figure 3. The Dorsal Longitudinal Vein supplies the mCP with its vascular network.
The Dorsal Longitudinal Vein (DLV) closely associates with the mCP epithelia as defined by doubly transgenic EtMn16/Tg(gata1:dsRed) dorsally-mounted 5 dpf live zebrafish, epithelia express GFP (A) and red blood cells express DsRed (B) merged image (C) (scale bars are 50 µm). The vessels, as defined by blood flow, directly contact the dorsal surface of the mCP. Low magnification of a 5 dpf dorsally mounted live EtMn16/Tg(gata1:dsRed), high magnification three-dimensional renders of DLV/PCeV junctions and TCB of zebrafish shown in D (E,F). Panel F is rotated 80° into the plane to show association (dorsal facing the top of the image). The DLV bends dorsally slightly before the bifurcation, traverses the mCP epithelial domain, and then turns ventrally as it transitions to the PCeV and PCeV′. Panels G and I are three-dimensional renders of the DLV, PCeV and TCB [(G,I – 85° rotation into the plane)(oriented with anterior to the right)]. The mCP has been digitally removed, and the DLV has been bisected utilizing the clipping tools of Image4D in order to define the vascular structure. Scale is as indicated on each render.
Figure 4
Figure 4. The DLV develops via angiogenic sprouting and supplies the mCP.
The development of the integral vasculature in the mCP was examined in living zebrafish larvae. The DLV (arrow in all panels) sprouts from the MCeV/MCeV′ (gray open arrowheads) via angiogenic sprouting between 40 hpf (A) and 48 hpf (B), and develops via growth cone-like filopodial extensions (C). The PCeV and PCeV′ (white open arrowheads) grow dorsomedially to meet the DLV in the roof of the fourth ventricle (D). Fusion occurs between the DLV (arrow) and PCeV or PCeV′ (E), followed by extension to the symmetric partner (PCeV or PCeV′) (F). Once connected, the DLV branches once more (G, small arrowhead) to form the trans-choroid plexus branch (TCB) (small arrowhead). By 120 hpf, the main vasculature of the mCP is in place (H). A diagrammatic representation of the final structure, with naming of the vessels and a superimposed mCP for comparison is shown (I). Small connecting vessels (concave arrow) connecting the DLV and TCB elaboration to form the mCP (J). Abbreviations: mesencephalic vein (MsV & MsV′), middle cerebral vessel (MCeV and MCeV′), dorsal longitudinal vein (DLV), posterior cerebral vein (PCeV and PCeV′) and myelencephalic choroid plexus (mCP). All images are oriented anterior to the left, and scale bars are 50 µm.
Figure 5
Figure 5. Notch signaling is required for proper development of the myelencephalic choroid plexus.
Pan Notch Inhibition with DAPT (B, dorsal-mounted live larvae and G, transverse section) results in an increase in the mCP epithelial domain compared to vehicle-treated control larvae (A, dorsal mounted live larvae and F, transverse section). This increase in domain size is due to lateral spreading as the mCP remains as a monolayer (G, DAPT-treated versus F, vehicle treated). Further analysis showed that this effect is mediated by inhibition of notch1b (D, 5 dpf live larvae) dla, and dld (E, 5 dpf live larvae). Inhibition of notch1a (C, 5 dpf live larvae) did not significantly alter the size of the mCP epithelial domain but did effect overt structure. Panels A–F are dorsal views with anterior to the left, and panels G and H are 6 µm cryosections labeled with an antibody against GFP (green) and DAPI (blue) staining the nuclei. Quantitative measurements show the distribution mCP sizes in individual fish. Measurements are shown for Notch receptor inhibition by DAPT and morpholino experiments (H), and for Notch ligand inhibition by morpholinos (I) Each point in the histograms represents a measurement of a live larval zebrafish mCP. The mean±s.e.m. is indicated by the line and error bars respectively. Significant effects on mCP size are observed for 10 µM DAPT, notch1b, dla, and dld knockdown (* p = 0.02 and *** p<0.0001). For a full list of mean, s.e.m., and p-values, see table S2. Abbreviations: eye (E), pectoral fin (Pf), and otic vesicle (Ov). Arrows indicate mCP. Scale bars are 50 µm.

References

    1. Netsky MG, Shuangshoti S, Tennyson VM, Brightman MW, Becker NH, et al. The Choroid Plexus in Health and Disease. Charlottesville, VA, USA: University Press of Virginia; 1975.
    1. Strazielle N, Ghersi-Egea JF. Choroid plexus in the central nervous system: biology and physiopathology. J Neuropathol Exp Neurol. 2000;59:561–574. - PubMed
    1. Tennyson VM, Appas GD. The fine structure of the choroid plexus adult and developmental stages. Prog Brain Res. 1968;29:63–85. - PubMed
    1. Sturrock RR. A morphological study of the development of the mouse choroid plexus. J Anat. 1979;129:777–793. - PMC - PubMed
    1. Jacobsen M, Clausen PP, Jacobsen GK, Saunders NR, Mollgard K. Intracellular plasma proteins in human fetal choroid plexus during development. I. Developmental stages in relation to the number of epithelial cells which contain albumin in telencephalic, diencephalic and myelencephalic choroid plexus. Brain Res. 1982;255:239–250. - PubMed

Publication types

LinkOut - more resources