. 2008 Oct;118(10):3343-54.
doi: 10.1172/JCI34871.

Apelin signaling antagonizes Ang II effects in mouse models of atherosclerosis

Affiliations

Apelin signaling antagonizes Ang II effects in mouse models of atherosclerosis

Hyung J Chun et al. J Clin Invest. 2008 Oct.

Abstract

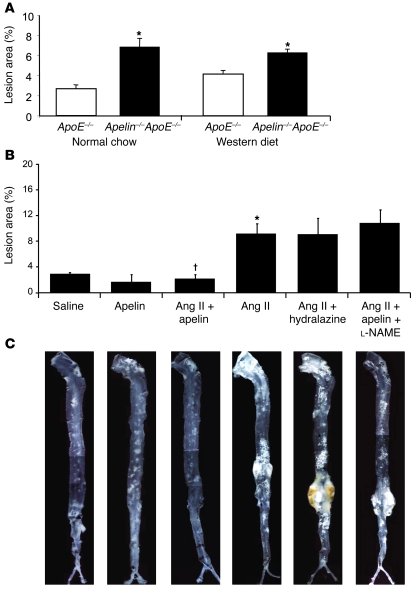
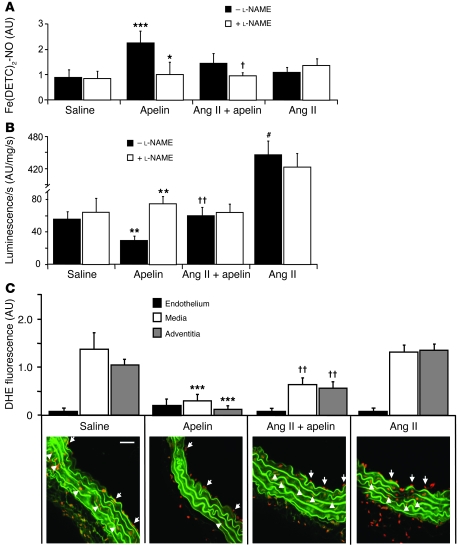
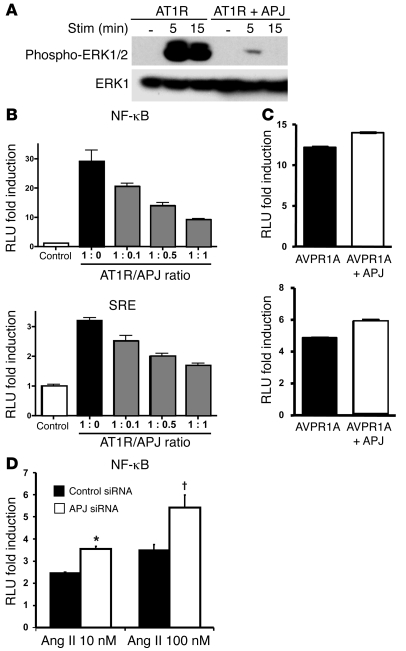
Apelin and its cognate G protein-coupled receptor APJ constitute a signaling pathway with a positive inotropic effect on cardiac function and a vasodepressor function in the systemic circulation. The apelin-APJ pathway appears to have opposing physiological roles to the renin-angiotensin system. Here we investigated whether the apelin-APJ pathway can directly antagonize vascular disease-related Ang II actions. In ApoE-KO mice, exogenous Ang II induced atherosclerosis and abdominal aortic aneurysm formation; we found that coinfusion of apelin abrogated these effects. Similarly, apelin treatment rescued Ang II-mediated increases in neointimal formation and vascular remodeling in a vein graft model. NO has previously been implicated in the vasodepressor function of apelin; we found that apelin treatment increased NO bioavailability in ApoE-KO mice. Furthermore, infusion of an NO synthase inhibitor blocked the apelin-mediated decrease in atherosclerosis and aneurysm formation. In rat primary aortic smooth muscle cells, apelin inhibited Ang II-mediated transcriptional regulation of multiple targets as measured by reporter assays. In addition, we demonstrated by coimmunoprecipitation and fluorescence resonance energy transfer analysis that the Ang II and apelin receptors interacted physically. Taken together, these findings indicate that apelin signaling can block Ang II actions in vascular disease by increasing NO production and inhibiting Ang II cellular signaling.


Figures

Figure 1
Figure 1. Apelin inhibits atherosclerosis in the ApoE-null model.
(A) Apelin-ApoE double-knockout and ApoE-KO mice were fed normal chow or high-fat Western diet, and atherosclerosis burden was evaluated by en face analysis of the thoracoabdominal aorta. Apelin-ApoE double-knockout mice developed significantly greater atherosclerotic lesions compared with ApoE-KO mice on both diets (2.53-fold increase, *P < 0.01 for normal chow; 1.50-fold increase, *P < 0.01 for Western diet). (B) Coinfusion of apelin mitigated the increased atherosclerotic lesion burden caused by Ang II when coadministered by osmotic minipump (*P < 0.01, Ang II compared with saline; P < 0.001, Ang II plus apelin compared with Ang II). Animals receiving Ang II and hydralazine had an atherosclerosis burden similar to that seen in the Ang II group. Administration of the NOS inhibitor l-NAME mitigated the beneficial effects of apelin, bringing atherosclerotic lesion burden to similar levels as mice infused with Ang II alone. (C) ApoE-KO mice treated with Ang II for 4 weeks showed a significant increase in aneurysm formation, and this effect was mitigated by apelin treatment. Administration of hydralazine with Ang II did not protect ApoE-KO mice from aneurysm formation. Mice treated with Ang II plus apelin plus l-NAME demonstrated aneurysm formation similar to Ang II mice. Representative aortas are shown for each experimental group. Original magnification, ×5.
Figure 2
Figure 2. Apelin inhibits the Ang II–mediated increase in blood pressure.
Systolic blood pressure (SBP) in the Ang II group was significantly increased compared with the saline control group (151 ± 7 mmHg versus 113 ± 4 mmHg; *P < 0.01). Concurrent infusion of apelin or administration of oral hydralazine eliminated this increase in blood pressure. Addition of l-NAME did not significantly increase the blood pressure.
Figure 3
Figure 3. Apelin inhibits Ang II–mediated progression of atherosclerosis in a vein graft model.
(A) Top row shows representative images of the vein graft cross sections stained with Masson/Goldner. Neointimal area, total vessel wall area, and neointimal vessel area were determined and compared among the experimental groups indicated. Apelin infusion significantly decreased each of these parameters compared with saline control group (*P < 0.05, **P < 0.001). Ang II infusion significantly increased all parameters in comparison to the control group (#P < 0.05), and this effect was significantly inhibited when apelin was administered along with Ang II (P < 0.05, ††P < 0.001). Neointima/vessel area ratios demonstrate that the beneficial effect of apelin treatment is more pronounced on neointimal hyperplasia. White arrows denote neointima and black arrows denote total vessel wall thickness. Scale bar: 100 μm. (B) SMC contribution to vascular wall disease was assessed by measuring the area occupied by SMC α-actin–stained cells in serial sections. Micrographs show representative images of the vein graft cross sections stained with α-actin antibody. Infusion of Ang II increased SMC content (##P < 0.01). Apelin infusion decreased the measured SMC component of the vessel cross-sectional area (**P < 0.001) compared with saline-treated animals and also decreased the SMC area when combined with Ang II infusion compared with Ang II infusion alone (††P < 0.001). Black arrows denote α-actin–positive staining. Scale bar: 100 μm. (C) The contribution of SMCs was also assessed as a proportion of the total vessel wall area. Apelin infusion decreased the proportion of SMC (*P < 0.05) compared with saline-treated animals and also decreased the SMC proportion when combined with Ang II infusion (††P < 0.001) compared with Ang II infusion alone.
Figure 4
Figure 4. Apelin increases vascular wall NO bioavailability and suppresses disease-related O2•– production.
(A) EPR spectroscopy was employed to measure NO in lung homogenates of ApoE-KO mice. Apelin infusion increased net lung NO levels compared with saline-treated controls (***P < 0.001). Inhibition of NOS by l-NAME attenuated net NO levels in apelin (*P < 0.05) and Ang II plus apelin (P < 0.05) lung homogenates, suggesting apelin stimulates NOS activity. (B) Aortic O2•– production, measured by lucigenin, was attenuated in apelin-treated mice (**P < 0.01) and increased in Ang II–treated mice (#P < 0.001) compared with saline-treated controls. Incubation with l-NAME increased luminescence in apelin-infused mice (**P < 0.01, intra-group comparison), suggesting apelin stimulated NO was quenching O2•– produced in the vessel wall. Luminescence was reduced in apelin-treated mice, even when coadministered with Ang II compared with animals treated with Ang II alone (††P < 0.01). (C) Dihydroethidium (DHE) fluorescence microscopy allowed topographic assessment of O2•– production in the vessel wall. There was no significant difference in endothelial O2•– production among the different experimental groups. Apelin decreased O2•– production compared with the saline control group for both the medial and adventitial vessel layers (78%, ***P < 0.001; 88%, ***P < 0.001, respectively). Apelin also decreased O2•– production in the media and adventitia when combined with Ang II, compared with the Ang II alone animals, although to a lesser degree (53%, ††P < 0.01; 45%, ††P < 0.01, respectively). Aortic elastic laminae exhibit green autofluorescence. White arrows denote endothelial O2•– producing cells, and white arrowheads denote medial O2•– producing cells. Scale bar: 5 μm.
Figure 5
Figure 5. Apelin inhibits Ang II cellular signaling.
(A) Ang II stimulation of RASMCs results in phosphorylation of ERK1/2, with marked inhibition by cotreatment with apelin at both 5 minutes (#P < 0.01) and 15 minutes (P < 0.05). The lanes are from the same gel and were noncontiguous. (B) Luciferase reporter constructs containing DNA binding sequences for NF-κB, nuclear factor of activated T cells (NFAT), activator protein–1 (AP-1), and SRE were transfected into HEK293 cells and assayed for increased transcription in response to Ang II, in the absence and presence of apelin. All 4 reporters showed decreased activation when cells were cotreated with apelin and Ang II (*P < 0.05). (C) NF-κB reporter activity stimulated by TNF-α and H2O2 was not affected by apelin treatment (P = 0.97 and P = 0.18, respectively).
Figure 6
Figure 6. AT1R and APJ receptors form heterodimer complexes.
(A) Immunoprecipitation using α-GFP antibody, followed by Western blot with α-HA antibody to detect APJ demonstrated a physical association between the 2 receptors. In the bottom panel control blot, the filled circle identifies AT1R-GFP and the triangle represents GFP. The band present in both lanes is the immunoprecipitating antibody detected by the secondary antibody. Numbers on the right reflect weights of protein standards in kDa. The lanes are from the same gel that were noncontiguous. (B) FRET analysis was performed with HEK293 cells cotransfected with APJ and AT1R expression constructs, with coding regions fused to either CFP or YFP. Specific interaction between APJ and AT1R is shown by increased FRET signal (blue curve) but not between either of these receptors and the Fas receptor (red curve). (C) Immunoprecipitation of AT1R-GFP and blotting of APJ-HA was employed to show increased association in the presence of Ang II at 1 hour and even greater association at 6 hours. Coadministration of apelin resulted in a modest increase in association compared with Ang II alone at 6 hours. A13, apelin-13. (D) FRET analysis showed an increase in AT1R and APJ association when cells were stimulated with Ang II. Addition of apelin led to a modest increase in FRET signal in cells treated with apelin alone compared with unstimulated cells and Ang II plus apelin–treated cells compared with cells treated with Ang II alone.
Figure 7
Figure 7. APJ receptor regulates Ang II signaling via AT1R independent of apelin.
(A) Western blotting of cells transfected with AT1R alone or with APJ revealed decreased phosphorylation of ERK1/2 in cells coexpressing APJ. The bottom panel shows control blot with total ERK1 antibody. (B) NF-κB and SRE reporter constructs transfected with an AT1R expression construct and varying amounts of APJ expression construct showed decreased signaling with greater APJ/AT1R ratios. Graphs represent mean ± SEM. (C) Coexpression of APJ did not inhibit vasopressin-induced nuclear signaling by the vasopressin receptors (AVPR1A and AVPR2) through the NF-κB consensus reporter. (D) Luciferase analysis using an NF-κB reporter construct with siRNA directed against APJ demonstrated enhanced Ang II response compared with control siRNA (*P < 0.05, P < 0.01).

References

    1. O’Dowd B.F., et al. A human gene that shows identity with the gene encoding the angiotensin receptor is located on chromosome 11. Gene. 1993;136:355–360. doi: 10.1016/0378-1119(93)90495-O. - DOI - PubMed
    1. Tatemoto K., et al. Isolation and characterization of a novel endogenous peptide ligand for the human APJ receptor. Biochem. Biophys. Res. Commun. 1998;251:471–476. doi: 10.1006/bbrc.1998.9489. - DOI - PubMed
    1. Chen M.M., et al. A novel role for the potent endogenous inotrope apelin in human cardiac dysfunction. Circulation. 2003;108:1432–1439. doi: 10.1161/01.CIR.0000091235.94914.75. - DOI - PubMed
    1. Kleinz M.J., Davenport A.P. Immunocytochemical localization of the endogenous vasoactive peptide apelin to human vascular and endocardial endothelial cells. Regul. Pept. 2004;118:119–125. doi: 10.1016/j.regpep.2003.11.002. - DOI - PubMed
    1. Kleinz M.J., Skepper J.N., Davenport A.P. Immunocytochemical localisation of the apelin receptor, APJ, to human cardiomyocytes, vascular smooth muscle and endothelial cells. Regul. Pept. 2005;126:233–240. doi: 10.1016/j.regpep.2004.10.019. - DOI - PubMed

Publication types

MeSH terms