

Dietary fructose consumption among US children and adults: the Third National Health and Nutrition Examination Survey
- PMID: 18769702
- PMCID: PMC2525476
Dietary fructose consumption among US children and adults: the Third National Health and Nutrition Examination Survey
Abstract
Context: High fructose intake has been associated with increased de novo lipogenesis in the liver as well as increased plasma triglycerides, insulin resistance, and obesity. Fructose occurs naturally in fruits and vegetables; however, it is added to many processed foods as table sugar (sucrose) and high-fructose corn syrup. Dietary data from a nationally representative sample in 1977-1978 estimated that mean consumption of fructose was 37 g/day (8% of total intake). Little is known about more recent fructose consumption patterns.
Objective: We determined the amount and sources of dietary fructose among US adults and children.
Design: We examined fructose consumption patterns by sex, age group, race/ethnicity, socioeconomic status, and body mass index for 21,483 children and adults. We used a single 24-hour dietary recall administered in the third National Health and Examination Survey (NHANES).
Main outcome measure: Weighted estimates of fructose intake were tested for significant differences (P < .05) between groups.
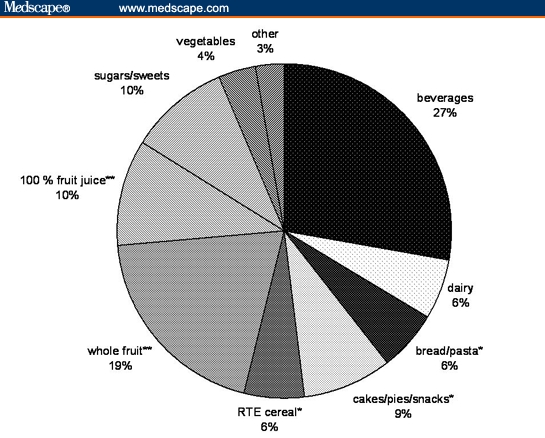
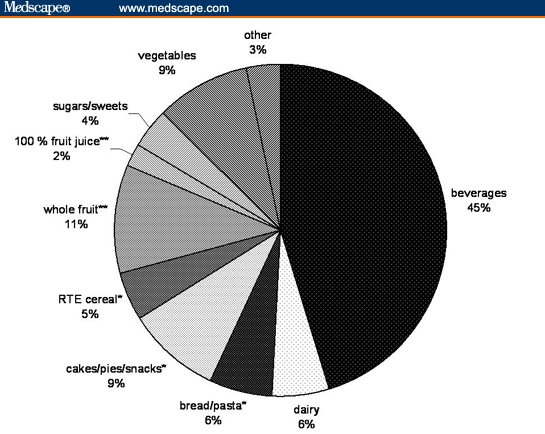
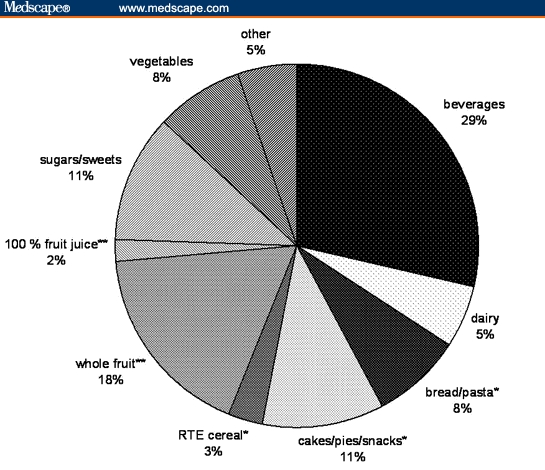
Results: The mean consumption of fructose was estimated to be 54.7g/day (range, 38.4-72.8) and accounted for 10.2% of total caloric intake. Consumption was highest among adolescents (12-18 years) at 72.8 g/day (12.1% of total calories). One fourth of adolescents consumed at least 15% of calories from fructose. The largest source of fructose was sugar-sweetened beverages (30%) followed by grains (22%) and fruit or fruit juice (19%).
Conclusions: Over 10% of Americans' daily calories were from fructose. These results, when compared with a previous nationally representative study, suggest that fructose consumption has increased. Further research is needed to understand the impact of increased intake of fructose on human health.
Figures
Comment in
-
Fructose--how worried should we be?Medscape J Med. 2008 Jul 9;10(7):159. Medscape J Med. 2008. PMID: 18769693 Free PMC article. No abstract available.
References
-
- US Department of Agriculture, Economic Research Service. Sugar and Sweeteners Yearbook 2008. Table 30 - US high fructose corn syrup (HFCS) supply and use. Table 51 - Refined cane and beet sugar: estimated number of per capita calories consumed daily, by calendar year. Table 52 - High fructose corn syrup: estimated number of per capita calories consumed daily, by calendar year. Table 53 - Other sweeteners: estimated number of per capita calories consumed daily, by calendar year. Available at: http://www.ers.usda.gov/briefing/sugar/data/data.htm Accessed June 20, 2008.
-
- Hanover L, White J. Manufacturing, composition, and applications of fructose. Am J Clin Nutr. 1993;5(Suppl):742S–732S. - PubMed
-
- Hoekstra J, van den Aker J. Facilitating effect of amino acids on fructose and sorbitol absorption in children. J Pediatr Gastroenterol Nutr. 1996;23:118–124. - PubMed
-
- Havel PJ. Dietary fructose: implications for dysregulation of energy homeostasis and lipid/carbohydrate metabolism. Nutr Rev. 2005;63:133–157. - PubMed
-
- Martinez F, Rizza R, Romero J. High-fructose feeding elicits insulin resistance, hyperinsulinism and hypertension in normal mongrel dogs. Hypertension. 1994;23:456–463. - PubMed
Publication types
MeSH terms
Substances
Grants and funding
LinkOut - more resources
Full Text Sources
Other Literature Sources
Medical