. 2008 Aug 29;3(8):e3099.
doi: 10.1371/journal.pone.0003099.

Binomial mitotic segregation of MYCN-carrying double minutes in neuroblastoma illustrates the role of randomness in oncogene amplification

Affiliations

Binomial mitotic segregation of MYCN-carrying double minutes in neuroblastoma illustrates the role of randomness in oncogene amplification

Gisela Lundberg et al. PLoS One. .

Abstract

Background: Amplification of the oncogene MYCN in double minutes (DMs) is a common finding in neuroblastoma (NB). Because DMs lack centromeric sequences it has been unclear how NB cells retain and amplify extrachromosomal MYCN copies during tumour development.

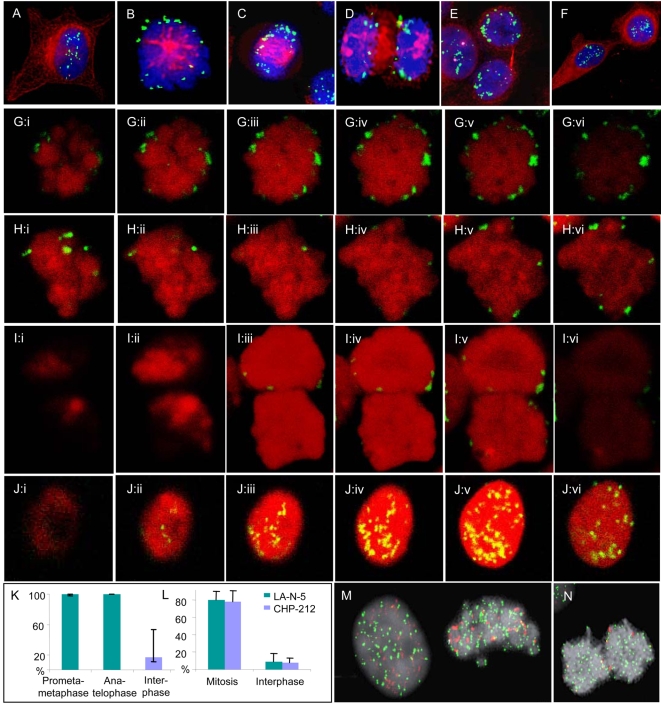
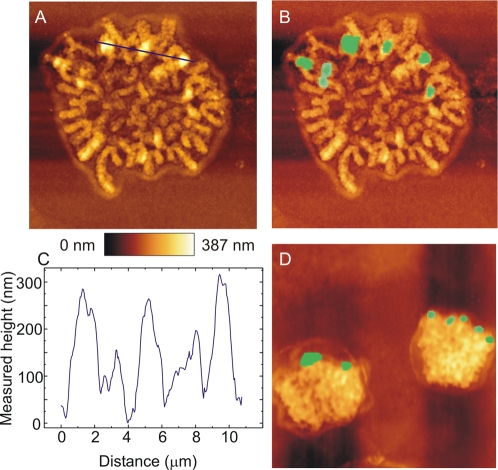
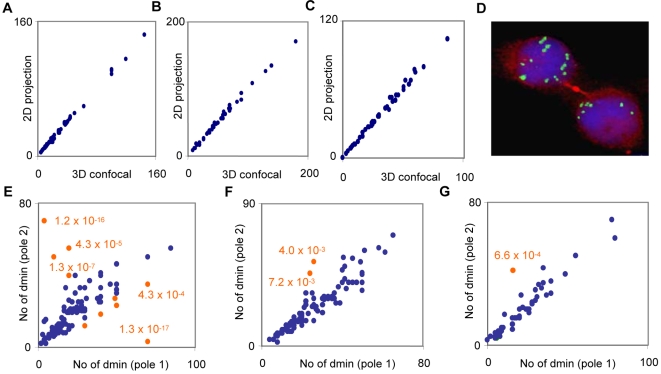
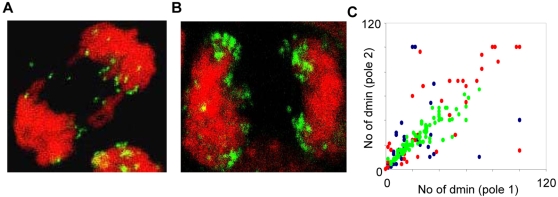
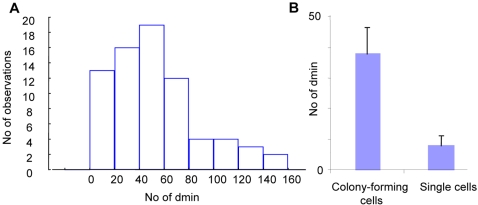
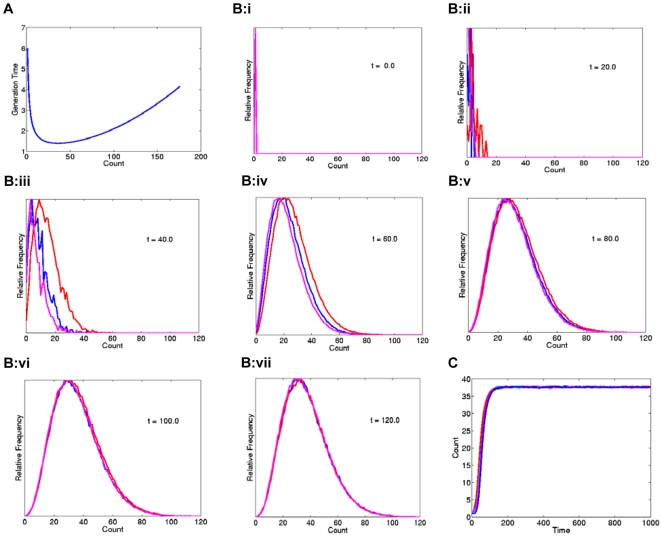
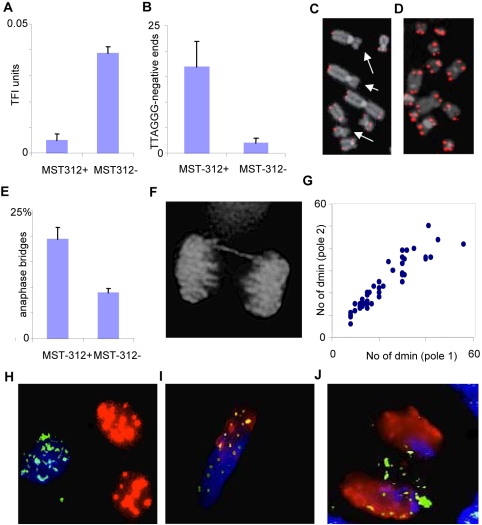
Principal findings: We show that MYCN-carrying DMs in NB cells translocate from the nuclear interior to the periphery of the condensing chromatin at transition from interphase to prophase and are preferentially located adjacent to the telomere repeat sequences of the chromosomes throughout cell division. However, DM segregation was not affected by disruption of the telosome nucleoprotein complex and DMs readily migrated from human to murine chromatin in human/mouse cell hybrids, indicating that they do not bind to specific positional elements in human chromosomes. Scoring DM copy-numbers in ana/telophase cells revealed that DM segregation could be closely approximated by a binomial random distribution. Colony-forming assay demonstrated a strong growth-advantage for NB cells with high DM (MYCN) copy-numbers, compared to NB cells with lower copy-numbers. In fact, the overall distribution of DMs in growing NB cell populations could be readily reproduced by a mathematical model assuming binomial segregation at cell division combined with a proliferative advantage for cells with high DM copy-numbers.

Conclusion: Binomial segregation at cell division explains the high degree of MYCN copy-number variability in NB. Our findings also provide a proof-of-principle for oncogene amplification through creation of genetic diversity by random events followed by Darwinian selection.


Conflict of interest statement

Competing Interests: The authors have declared that no competing interests exist.

Figures

Figure 1
Figure 1. Fluorescence microscopy.
All figures are from CHP-212. A–F. Combined immunofluorescence (IF) for beta tubulin (red), fluorescence in situ hybridisation (FISH) with a MYCN probe (green), and chromatin counterstaining by DAPI (blue) shows translocation of DMs to the periphery of the chromosome rosette at transition from interphase (A) to prometaphase (B); the peripheral localisation is maintained through metaphase (C), anaphase (D) and telophase (E), after which DMs again transfer to interior positions in the nucleus (F). G–J. Serial confocal optical sections (i–vi) corroborate the peripheral positions of DMs (green) at prometaphase (G), metaphase (H), and telophase (I), in contrast to a more central localisation at interphase (J); chromatin is counterstained by DRAQ5 (red). K. Proportion of peripheral DMs at prometa/metaphase, ana/telophase, and interphase; error bars denote standard deviation. L. The proportion of DM (MYCN) signals overlapping with telomeric TTAGGG-repeat signals at mitosis and interphase, respectively, in LA-N-5 and CHP-212. M–N. FISH for telomeric TTAGGG sequences (green) and MYCN (red) shows more frequent overlapping of signals for telomeres and DMs at metaphase (M, right) and telophase (N), compared to interphase (M, left).
Figure 2
Figure 2. Atomic force microscopy.
A. Atomic force microscopy of a CHP-212 prometaphase cell. B. Superimposition of MYCN fluorescence in situ hybridisation (FISH) signals allows localisation of DMs in the AFM image. C. Surface plot of the segment indicated by a blue line in A shows that DMs correspond to surface peaks of approximately 200 nm. D. Superimposed AFM and FISH images show peripheral location of DMs in a late telophase cell. Surface height is shown by the heat map and surface dimensions are indicated by scale bars corresponding to 2 µm in A, B and D.
Figure 3
Figure 3. Statistics of DM segregation.
A–C. DM copy-numbers in interphase nuclei obtained by scoring 1 µm confocal optical sections (three-dimensional, 3D) plotted against the copy-number obtained by scoring a projected (two-dimensional, 2D) image in LA-N-5 (A), CHP-212 (B) and MC-IX (C). D. Segregation of 7 and 10 DMs, respectively, to each daughter cell at telophase, shown by IF for beta tubulin (red) and FISH for MYCN (green). E–G. DM copy-numbers in ana/telophase poles typically follow a binomial distribution (blue data points) in LA-N-5 (E), CHP-212 (F), and MC-IX (G); ana-telophase cells significantly (p<0.01) deviating from the binomial distribution are denoted by orange data points.
Figure 4
Figure 4. Clustering of DM at high copy-number.
A–B. Clustering of DMs at cell division is less frequent in cells with lower (A) than with higher (B) DM copy-number, here exemplified by two anaphase cells. C. DM copy-numbers in CHP-212 ana/telophase poles prior to irradiation (green data points), after irradiation with 2 Gy (red data points), and after irradiation with 4 Gy (blue data points).
Figure 5
Figure 5. DM copy-number distributions in bulk populations.
A. The frequency distribution of DM copy-numbers in near-diploid metaphase cells in LA-N-5 is skewed and differs from a normal distribution. B. Median DM-copy numbers in colony-forming compared to non-colony forming CHP-212 cells; error bars denote 25th and 75th percentiles.
Figure 6
Figure 6. Mathematical modelling.
A. Cellular generation time described as a continuous function of the DM-copy number count, with longer generation times for cells with low as well as extremely high DM copy-numbers. Each simulation was initiated with a single cell starting with a DM count equal to 1 at time zero. Cells with 36 DMs have the shortest generation time in the present model, while cells with fewer or extremely high DM-copy numbers proliferate more slowly. B. Convergence towards a skewed distribution for three modelled cell populations (purple, red, and blue curves). C. The equilibrium DM modal numbers for all populations correspond to the copy-number resulting in the shortest generation time in A (n = 36).
Figure 7
Figure 7. DMs do not bind to telomeres or other specific positional elements.
A–B. Mean telomere length (A) assessed by arbitrary telomere fluorescence intensity (TFI) units and dysfunctional telomeres identified as the mean number of TTAGGG-negative chromosome termini (B) in CHP-212 cells exposed (MST312+) and not exposed (MST312-) to a telomerase inhibitor; errors bars denote standard deviations. C–D. A higher number of TTAGGG-negative chromosome termini (arrows) are observed by FISH after telomerase inhibition (C), compared to CHP-212 cells not exposed to the MST-312 inhibitor (D). E–F. Elevated frequency of anaphase bridging after MST-312 treatment. G. The DM distribution between telophase poles does not deviate from a binomial distribution after telomere dysfunction was induced by telomerase inhibition (P>0.01 for all data points). H–J. Co-hybridisation with mouse Cot-1 DNA (red), human Cot-1 DNA (blue) and human MYCN (green) probes readily distinguishes between the nuclei of co-cultured murine 3T3 and human CHP-212 cells (H); this labelling protocol also differentiates between murine and human chromatin domains in a murine/human hybrid nucleus (I) and in an anaphase cell (J) where some DMs have migrated into the murine chromatin domains (green-yellow in I and J).

References

    1. Seeger RC, Brodeur GM, Sather H, Dalton A, Siegel SE, et al. Association of multiple copies of the N-myc oncogene with rapid progression of neuroblastomas. N Engl J Med. 1985;313:1111–1116. - PubMed
    1. Brodeur GM. Neuroblastoma: biological insights into a clinical enigma. Nat Rev Cancer. 2003;3:203–216. - PubMed
    1. Norris MD, Bordow SB, Haber PS, Marshall GM, Kavallaris M, et al. Evidence that the MYCN oncogene regulates MRP gene expression in neuroblastoma. Eur J Cancer. 1997;33:1911–1916. - PubMed
    1. Shohet JM, Hicks MJ, Plon SE, Burlingame SM, Stuart S, et al. Minichromosome maintenance protein MCM7 is a direct target of the MYCN transcription factor in neuroblastoma. Cancer Res. 2002;62:1123–1128. - PubMed
    1. Narath R, Ambros IM, Kowalska A, Bozsaky E, Boukamp P, et al. Induction of senescence in MYCN amplified neuroblastoma cell lines by hydroxyurea. Genes Chromosomes Cancer. 2007;46:130–142. - PubMed

Publication types