. 2008 Aug 29;3(8):e3097.
doi: 10.1371/journal.pone.0003097.

Trogocytosis of MHC-I/peptide complexes derived from tumors and infected cells enhances dendritic cell cross-priming and promotes adaptive T cell responses

Affiliations

Trogocytosis of MHC-I/peptide complexes derived from tumors and infected cells enhances dendritic cell cross-priming and promotes adaptive T cell responses

Qian-Jin Zhang et al. PLoS One. .

Abstract

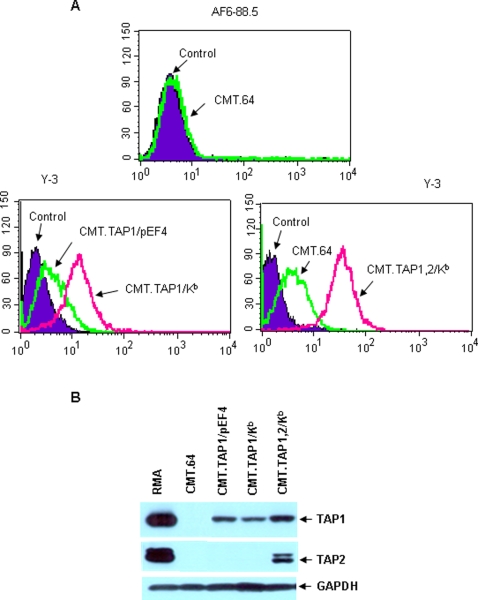
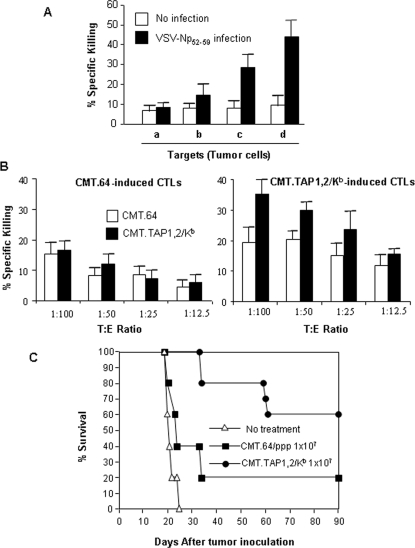
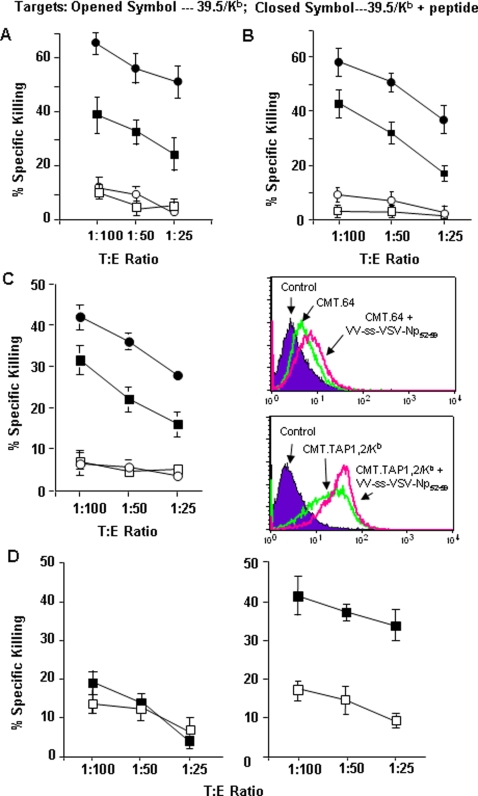
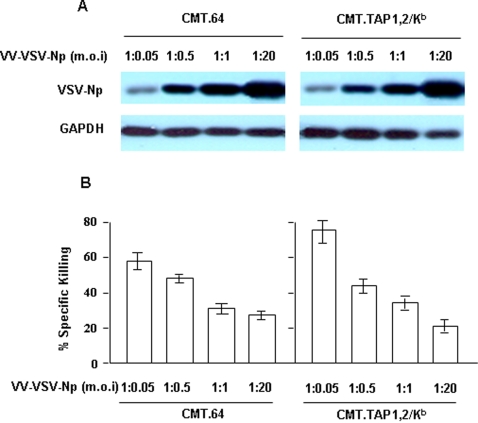
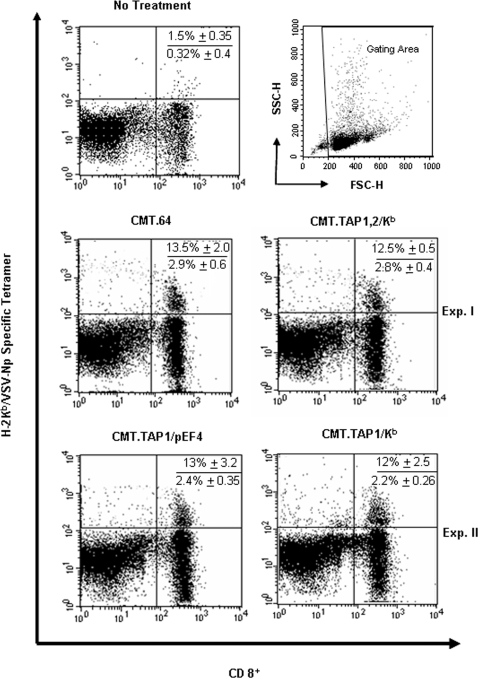
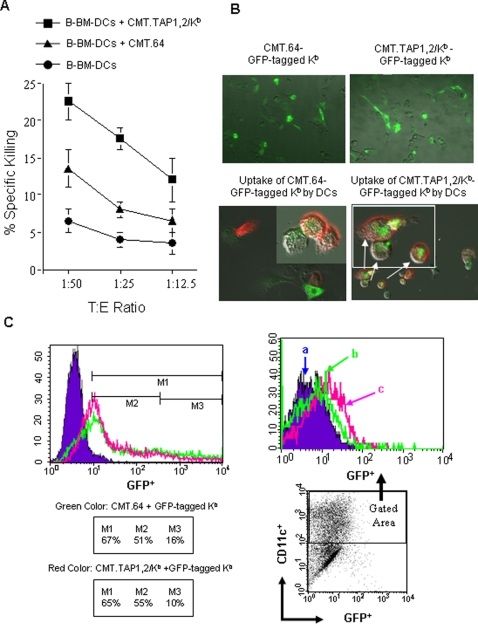
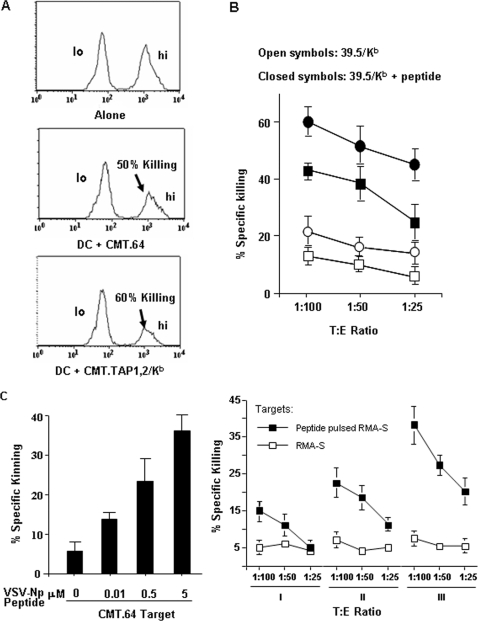
The transporter associated with antigen processing (TAP) and the major histocompatibility complex class I (MHC-I), two important components of the MHC-I antigen presentation pathway, are often deficient in tumor cells. The restoration of their expression has been shown to restore the antigenicity and immunogenicity of tumor cells. However, it is unclear whether TAP and MHC-I expression in tumor cells can affect the induction phase of the T cell response. To address this issue, we expressed viral antigens in tumors that are either deficient or proficient in TAP and MHC-I expression. The relative efficiency of direct immunization or immunization through cross-presentation in promoting adaptive T cell responses was compared. The results demonstrated that stimulation of animals with TAP and MHC-I proficient tumor cells generated antigen specific T cells with greater killing activities than those of TAP and MHC-I deficient tumor cells. This discrepancy was traced to differences in the ability of dendritic cells (DCs) to access and sample different antigen reservoirs in TAP and MHC-I proficient versus deficient cells and thereby stimulate adaptive immune responses through the process of cross-presentation. In addition, our data suggest that the increased activity of T cells is caused by the enhanced DC uptake and utilization of MHC-I/peptide complexes from the proficient cells as an additional source of processed antigen. Furthermore, we demonstrate that immune-escape and metastasis are promoted in the absence of this DC 'arming' mechanism. Physiologically, this novel form of DC antigen sampling resembles trogocytosis, and acts to enhance T cell priming and increase the efficacy of adaptive immune responses against tumors and infectious pathogens.


Conflict of interest statement

Competing Interests: The authors have declared that no competing interests exist.

Figures

Figure 1
Figure 1. Expression of transfected TAP and Kb molecules in CMT.64 cells.
Kb and TAP expression in CMT.64 transfectants was examined. A) FACS assay was performed to detect expression of the Kb molecule by direct immunostaining using R-PE-conjugated Kb-specific mAb AF6-88.5, and R-PE-conjugated Kk-specific Ab 36-7-5 was used as a control (top panel). In addition, indirect immunostaining was performed using Y-3 Ab against Kb followed by labeling with FITC-conjugated goat anti-mouse IgG Ab. The samples labeled with only FITC-conjugated goat anti-mouse IgG Ab were used as controls (meddle panel). B) Western blots were performed to detect mouse TAP1 and TAP2 expression using the respective polyclonal antibodies respectively (see Material and Methods). GAPDH protein was detected in each sample as the loading control.
Figure 2
Figure 2. CMT.64 TAP/MHC I transfectants but not wild-type CMT.64 cells present antigens and induce an immune response.
In vitro cytotoxicity assays and in vivo challenge assays were performed to determine the antigen presentation by the tumor cells and anti-tumor immune response. A) Determination of antigen presentation: Cells were infected with VV-VSV-Np52-59 at 1∶20 (m.o.i) overnight, labeled with 51Cr and used as the targets. The VSV-Np52–59 specific splenocyte-derived CTLs were generated by immunization of mice with VV-VSV-Np52–59 at 2×10⁷ (pfu) viruses per mouse. The target to effector ratio used was 1∶100. a – CMT.64; b – CMT.TAP1/pEF4; c – CMT.TAP1/Kb and d – CMT.TAP1,2/Kb. The mean value of the results from two experiments is shown. B) Determination of anti-tumor immune response: CMT.64 and CMT.TAP1,2/Kb immunized splenocytes were used as two effectors and 51Cr-labeled CMT.64 and CMT.TAP1,2/Kb cells were used as targets. The mean value of the results from two experiments is shown. C) Left: Mice were immunized ip. with 1×10⁷ γ-irradiated CMT.TAP1,2/Kb, CMT.64/ppp cells (experimental control) or PBS (negative control. After day 20 of immunization, the mouse was challenged ip. with 2.5×10⁵ cells/mouse CMT.TAP1,2/Kb cells. Each group contained 10 mice. Time of morbidity was recorded. Statistical analysis of survival curves is shown below: P>0.05 was used for comparison between CMT.64/ppp-immunized and negative control groups; P<0.001 was for the comparison between CMT.TAP1,2/Kb-immunized and negative control; P<0.05 was used for comparison between the CMT.TAP1,2/Kb- and CMT.64/ppp-immunized groups. It should be noted that CMT.64/ppp, instead of CMT.64, were used to immunize mice is to control for immune responses against components of the three vectors used to transfect TAP and Kb.
Figure 3
Figure 3. Increased killing activities of VSV-Np52–59 specific CTLs generated by TAP and Kb expressing tumor cells.
Standard 4-h 51Cr-release assays were performed to detect the killing activities of the spleen-derived antigen specific CTLs. The CTLs were generated by immunization of 1×10⁷ cells/mouse γ-irradiated CMT.64, CMT.TAP1/pEF4, CMT.TAP1/Kb or CMT.TAP1,2/Kb cells that were infected with VV-VSV-Np52–59 B or VV-ss-VSV-Np52–59 virus at 1∶20 (m.o.i) overnight and re-stimulated with VSV-Np52–59 peptide in vitro. The 51Cr-labeled 39.5/Kb cells pulsed with or without VSV-Np52–59 peptide were used as targets. A) Square symbol — CTLs generated by CMT.64+VV-VSV- Np52–59; Round symbol — CTLs generated by CMT.TAP1/Kb+VV-VSV-Np52–59. The mean value of the results from three experiments is shown. B) Square symbol — CTLs generated by CMT.TAP1/pEF4+VV-VSV-Np52–59; Round symbol — CTLs generated by CMT.TAP1/Kb+VV-VSV-Np52–59. The mean value of the results from three experiments is shown. C) Left: Square symbol — CTLs generated by CMT.64+VV-ss-VSV-Np52–59; Round symbol — CTLs generated by CMT.TAP1,2/Kb+VV-ss-VSV-Np52–59. The results represented the mean value from three experiments. Right: FACS assay was performed to detect surface Kb expression. D). CTLs were generated by immunization of mice with 1×10⁷ pfu γ-irradiated (Left panel) and non-irradiated (Right panel) VV-VSV-Np52–59. The results represent the mean value from two experiments.
Figure 4
Figure 4. Increased killing activity of CTLs generated by CMT.TAP1,2/Kb infected with the lowest dose of VV-VSV-Np.
The CMT.TAP1,2/Kb and CMT.64 cells were infected with VV-VSV-Np virus at varied m.o.i. A) Western blots were performed to detect VSV-Np protein expression. B) Standard 4-h 51Cr-release assays were conducted to determine the activities of the CTLs generated by varied viral-dose infected CMT.TAP1,2/Kb and CMT.64 cells (1×10⁷ cells/mouse). The 51Cr-labeled 39.5/Kb cells pulsed with VSV-Np52–59 peptide were used as targets. 1∶50 target to effector ratio is shown. The mean value of the results from two experiments is shown.
Figure 5
Figure 5. Similar frequencies of VSV-Np52–59 specific T cells generated by immunization of different tumor cells.
Tumor cells were infected with VV-VSV-Np52–59 overnight and were γ-irradiated. The cells were then injected into mice. After immunization, the frequency of VSV-Np52–59 specific CD8+ T cells derived from splenocytes was analyzed by FACS assay using double staining with an anti-mouse CD8a antibody and a Kb/VSV-Np52–59 specific tetramer. The gating area was set up to include all cells except erythrocytes and debris (right plot at top panel). Exp. I and Exp. II indicate that tetramer assays were performed separately. One out of two tetramer assays is shown. The numbers inserted in each picture represent the mean value of results (mean±SEM) from two experiments. Numbers shown in top are percentages of tetramer positive cells in total CD8+ T cells. Numbers shown in bottom are percentages of tetramer positive cells in total splenocytes.
Figure 6
Figure 6. Uptake of the MHC-I/peptide complex and expression on the surface of the tumor cells by BM-DCs.
Uptake of Kb molecules by BM-DCs was quantified using in vitro cytotoxicity assays, multi-channel fluorescence microscopy and FACS assays. A) B-BM-DCs were incubated with γ-irradiated CMT.64 or CMT.TAP1,2/Kb cells that were infected with 1∶10 pfu VV-VSV-Np52–59. The matured B-BM-DCs were used as 51Cr-labeled targets in cytotoxicity assays. The mean value of the results (Mean±SEM) from two experiments is shown. B). C-BM-DCs were co-cultured with γ-irradiated CMT.64 and CMT.TAP1,2/Kb cells transiently transfected with GFP-tagged Kb vector (green color). After 6 hours incubation, DCs were treated with LPS overnight. DC samples were then labeled with Alexa Fluor 647 anti-mouse CD11c antibody (red color), and dual-channel fluorescence was visualized by using a Zeiss AxioObserver Z1 widefield microscope. The top-panel indicates that tumor cells transiently expressed GFP-tagged Kb and that most cells were weakly GFP positive. The bottom-panel (including inserted images) indicates that DCs took up the green label from tumor cells. Arrows show the same cells enlarged. C). FACS assays was performed to detect GFP expression. Left panel: CMT.64 cells (green) and CMT.TAP1,2/Kb cells (red) transiently transfected with GFP-tagged Kb vector overnight and GFP expression was detected. CMT.64 cells without transfection (Blue) were used as control. CMT.TAP1,2/Kb cells without transfection has fluorescence intensity similar to CMT.64 cells (data not shown). In inserted table, M1 shows the percentage of total GFP positive cells; M2 shows the percentage of weak GFP positive cells and M3 shows the percentage of high GFP positive cells. Right panel: C-BM-DCs, that were prepared similar to those depicted in B, were labeled with PE-conjugated anti-mouse CD11c. GFP-fluorescence intensity of DCs in a histogram at top was gated for CD11c positive cells (shown in a dot-plot at bottom). a — DCs incubated with γ-irradiated CMT.64 cells; b — DCs incubated with γ-irradiated, GFP-tagged Kb transfected CMT.64 cells; c — DCs incubated with γ-irradiated, GFP-tagged Kb transfected CMT.TAP1,2/Kb cells.
Figure 7
Figure 7. T cell priming by BM-DCs activated by H-2Kb/VSV-Np complexes on the surface of tumor cells.
A) B-BM-DCs were incubated with γ-irradiated CMT.64 or CMT.TAP1,2/Kb cells that were infected with 1∶10 pfu VV-VSV-Np52–59. After extensive washing, B-BM-DCs were immunized to naïve C57BL/6 mice to perform in vivo cytotoxicity assays. The C57BL/6 mice without immunization were used as controls (see material and methods for detail). One representative of two experiments is shown. In the two experiments, the mean value (percentage) of killing was 57.5%±2.5 (Mean % killing±SEM) for DCs co-cultured with γ-irradiated and VV-VSV-Np52–59-infected CMT.TAP1,2/Kb and 46.5%±3.5 (Mean % killing±SEM) for DCs co-cultured with γ-irradiated and VV-VSV-Np52–59-infected CMT.64. B) C-BM-DCs were treated as A) and immunized to naïve C57BL/6 mice. Spleens from the immunized mice were used as CTLs. Standard 4-h 51Cr-release assays were performed and the 39.5/Kb cells pulsed with or without VSV-Np52–59 were used as targets. The mean value of the results from three experiments is shown. C). Standard 4-h 51Cr-release assays were performed. Left panel: CMT.64 cells pulsed with 0.01, 0.5 and 5 µM VSV-Np52–59 peptide were used as target cells, and CTLs were generated by immunization with 39.5/Kb cells pulsed with VSV-Np52–59 peptide. Right panel: C-BM-DCs were incubated with γ-irradiated CMT.64 cells that were pulsed with 0.01, 0.5 or 5 µM VSV-Np52–59 peptide. After extensive washing, the DCs were injected into mice to generate VSV-Np52–59 epitope specific CTLs (splenocytes). RMA-S and VSV-Np52–59 (2 µM) peptide-pulsed RMA-S cells were used as targets. I, II and III indicated that CTLs generated by immunization of DCs co-cultured with CMT.64 cells pulsed with 0.01 (I), 0.5 (II) and 5 (III) µM peptide. The results represent the mean value of the results from two experiments.

Similar articles

Cited by

References

    1. Jefferies WA, Kolaitis G, Gabathuler R. IFN-gamma-induced recognition of the antigen-processing variant CMT.64 by cytolytic T cells can be replaced by sequential addition of beta 2 microglobulin and antigenic peptides. J Immunol. 1993;151:2974–2985. - PubMed
    1. Gabathuler R, Reid G, Kolaitis G, Driscoll J, Jefferies WA. Comparison of cell lines deficient in antigen presentation reveals a functional role for TAP-1 alone in antigen processing. J Exp Med. 1994;180:1415–1425. - PMC - PubMed
    1. Seliger B, Maeurer MJ, Ferrone S. TAP off–tumors on. Immunol Today. 1997;18:292–299. - PubMed
    1. Seliger B, Maeurer MJ, Ferrone S. Antigen-processing machinery breakdown and tumor growth. Immunol Today. 2000;21:455–464. - PubMed
    1. Garcia-Lora A, Algarra I, Garrido F. MHC class I antigens, immune surveillance, and tumor immune escape. J Cell Physiol. 2003;195:346–355. - PubMed

Publication types

MeSH terms

Substances