. 2009 Jun;22(3):222-31.
doi: 10.1007/s10278-008-9152-x. Epub 2008 Sep 3.

Automated separation of visceral and subcutaneous adiposity in in vivo microcomputed tomographies of mice

Affiliations

Automated separation of visceral and subcutaneous adiposity in in vivo microcomputed tomographies of mice

Svetlana Lublinsky et al. J Digit Imaging. 2009 Jun.

Abstract

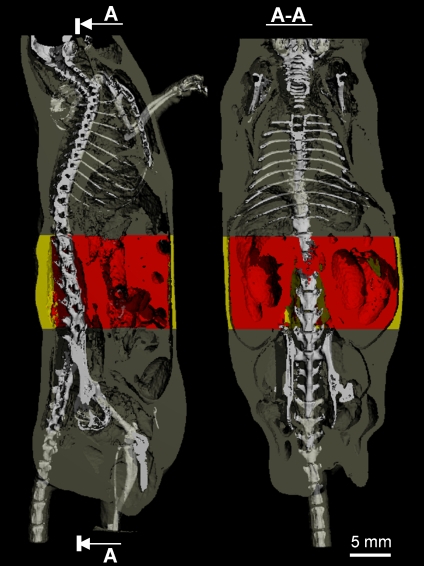
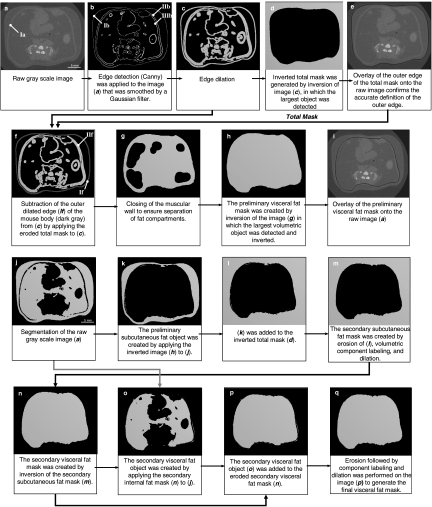
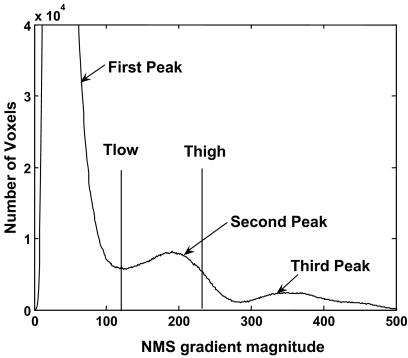
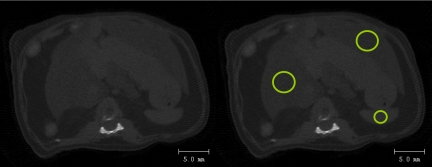
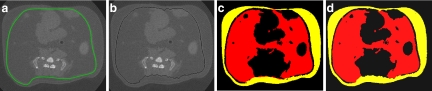
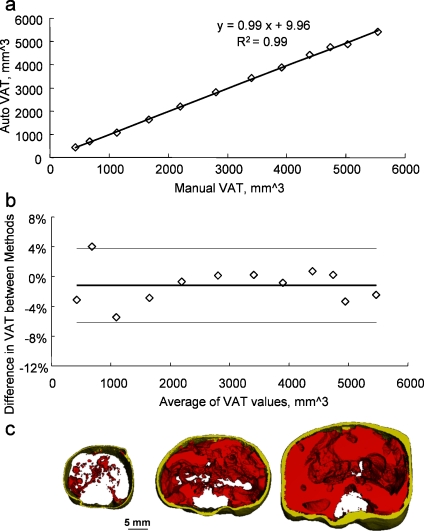
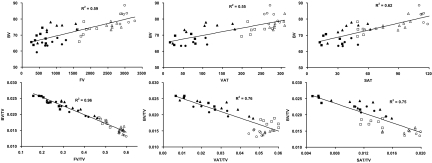
Reflecting its high resolution and contrast capabilities, microcomputed tomography (microCT) can provide an in vivo assessment of adiposity with excellent spatial specificity in the mouse. Herein, an automated algorithm that separates the total abdominal adiposity into visceral and subcutaneous compartments is detailed. This algorithm relies on Canny edge detection and mathematical morphological operations to automate the manual contouring process that is otherwise required to spatially delineate the different adipose deposits. The algorithm was tested and verified with microCT scans from 74 C57BL/6J mice that had a broad range of body weights and adiposity. Despite the heterogeneity within this sample of mice, the algorithm demonstrated a high degree of stability and robustness that did not necessitate changing of any of the initially set input variables. Comparisons of data between the automated and manual methods were in complete agreement (R (2) = 0.99). Compared to manual contouring, the increase in precision and accuracy, while decreasing processing time by at least an order of magnitude, suggests that this algorithm can be used effectively to separately assess the development of total, visceral, and subcutaneous adiposity. As an application of this method, preliminary data from adult mice suggest that a relative increase in either subcutaneous, visceral, or total fat negatively influences skeletal quantity and that fat infiltration in the liver is greatly increased by a high-fat diet.


Figures

Fig 1
Fig 1
A sagittal (left panel) and coronal (right panel) view of a mouse body scanned by in vivo microcomputed tomography. The skeleton was superimposed upon the adipose tissue (gray) to allow for greater spatial clarity. The abdominal VOI, in which the separation between subcutaneous (yellow) and visceral (red) fat was performed, was defined by precise skeletal landmarks.
Fig 2
Fig 2
Identification of the outer edge (ae) and separation of visceral and subcutaneous fat (fi). The contours Ia and IIf represent the abdominal muscular wall. Ib is the outer edge of the mouse body. IIb defines the interface of the muscular wall and VAT. IIIb defines the interface of the muscular wall and SAT. In images jm and nq, the subcutaneous and visceral fat mask were generated, respectively. Objects in black represent background.
Fig 3
Fig 3
Trimodal histogram of the nonmaximal suppression (NMS) gradient magnitude that serves to select the hysteresis threshold Thigh and Tlow for adipose tissue. The large first peak at the lower end of the gradient spectrum represents texture of the image background while the third peak for the highest gradient is associated with edges of calcified tissue. The second peak in the intermediate gradient range describes the edges of adipose tissue. Thigh was identified at two thirds of the magnitude of the second peak and Tlow coincided with the minimum (valley) between the first and second peak.
Fig 4
Fig 4
Left: a raw μCT image from the region between the 13th thoracic and first lumbar vertebra was used to calculate the degree of fat in the liver. No contrast agent was used. Right: density values were determined for all voxels within the highlighted circular regions (12 mm2 for liver and 3 mm2 for spleen). These regions were selected as to be approximately in the center of the spleen and the left and right lobes of the liver. The average liver density of each mouse was calculated as the average of the two lobes.
Fig 5
Fig 5
A typical abdominal transverse mCT section from an adult mouse in which the contour line that separated visceral from subcutaneous compartments was (a) drawn manually or (b) produced by the automated algorithm. The two segmentation methods produced very similar segmented areas of visceral (red) or subcutaneous (yellow) fat (c, d).
Fig 6
Fig 6
Direct comparison of visceral adipose tissue (VAT) values between the automated algorithm and the manual tracing method (n = 12). a Regression between the manual and automatic data produced an excellent coefficient of determination. b Bland–Altman plot comparing the relative difference in VAT values between the two methods. Solid line represents the mean of the relative differences between the algorithm and the manual data as calculated by (auto − manual) / (average of manual and auto). Dashed lines represent the 95% confidence intervals. c Representative segmented images of abdominal VOIs showing the large range in visceral and subcutaneous adipose volumes.
Fig 7
Fig 7
Top row: correlations between absolute values of bone volume (BV) and either total body fat volume (FV), visceral adipose tissue (VAT), or subcutaneous adipose tissue (SAT) across mice that were raised either on a regular (solid markers) or high-fat diet (hollow markers). Squares, triangles, and circles correspond to data generated at 3, 6, and 9 months of age, respectively. Bottom row: correlations between the same variables when normalized to the volume of each animal (TV).

Similar articles

Cited by

References

    1. Muller R, Hahn M, Vogel M, Delling G, Ruegsegger P. Morphometric analysis of noninvasively assessed bone biopsies: comparison of high-resolution computed tomography and histologic sections. Bone. 1996;18(3):215–220. doi: 10.1016/8756-3282(95)00489-0. - DOI - PubMed
    1. Ruegsegger P, Koller B, Muller R. A microtomographic system for the nondestructive evaluation of bone architecture. Calcif Tissue Int. 1996;58(1):24–29. doi: 10.1007/BF02509542. - DOI - PubMed
    1. Garman R, Rubin C, Judex S. Small oscillatory accelerations, independent of matrix deformations, increase osteoblast activity and enhance bone morphology. PLoS ONE. 2007;2:e653. doi: 10.1371/journal.pone.0000653. - DOI - PMC - PubMed
    1. Rubin CT, Capilla E, Luu YK, Busa B, Crawford H, Nolan DJ, Mittal V, Rosen CJ, Pessin JE, Judex S. Adipogenesis is inhibited by brief, daily exposure to high-frequency, extremely low-magnitude mechanical signals. Proc Natl Acad Sci U S A. 2007;104(45):17879–17884. doi: 10.1073/pnas.0708467104. - DOI - PMC - PubMed
    1. Bastie CC, Zong H, Xu J, Busa B, Judex S, Kurland IJ, Pessin JE. Integrative metabolic regulation of peripheral tissue fatty acid oxidation by the SRC kinase family member Fyn. Cell Metab. 2007;5(5):371–381. doi: 10.1016/j.cmet.2007.04.005. - DOI - PubMed

Publication types