. 2008 Nov;164(2):221-7.
doi: 10.1016/j.jsb.2008.07.011. Epub 2008 Aug 15.

Radiation dose reduction and image enhancement in biological imaging through equally-sloped tomography

Affiliations

Radiation dose reduction and image enhancement in biological imaging through equally-sloped tomography

Edwin Lee et al. J Struct Biol. 2008 Nov.

Abstract

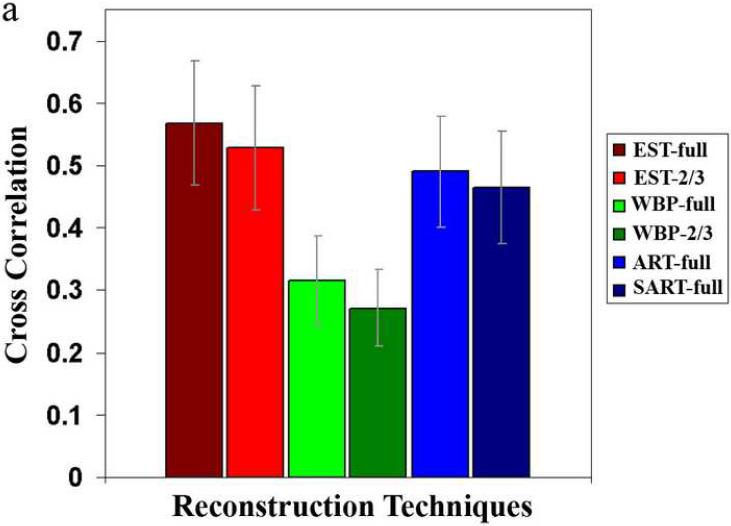
Electron tomography is currently the highest resolution imaging modality available to study the 3D structures of pleomorphic macromolecular assemblies, viruses, organelles and cells. Unfortunately, the resolution is currently limited to 3-5nm by several factors including the dose tolerance of biological specimens and the inaccessibility of certain tilt angles. Here we report the first experimental demonstration of equally-sloped tomography (EST) to alleviate these problems. As a proof of principle, we applied EST to reconstructing frozen-hydrated keyhole limpet hemocyanin molecules from a tilt-series taken with constant slope increments. In comparison with weighted back-projection (WBP), the algebraic reconstruction technique (ART) and the simultaneous algebraic reconstruction technique (SART), EST reconstructions exhibited higher contrast, less peripheral noise, more easily detectable molecular boundaries and reduced missing wedge effects. More importantly, EST reconstructions including only two-thirds the original images appeared to have the same resolution as full WBP reconstructions, suggesting that EST can either reduce the dose required to reach a given resolution or allow higher resolutions to be achieved with a given dose. EST was also applied to reconstructing a frozen-hydrated bacterial cell from a tilt-series taken with constant angular increments. The results confirmed similar benefits when standard tilts are utilized.


Figures

Figure 1
Figure 1
Pseudo-polar grid and pseudo-polar fast Fourier transform. For an N × N Cartesian grid where N = 8 in this case, the corresponding pseudo-polar grid is defined by a set of 2N lines, each line consisting of 2N grid points mapped out on N concentric squares. The 2N lines are subdivided into a horizontal group (in blue) and a vertical group (in red) with constant slope increments in each group.
Figure 2
Figure 2
Schematic layout of the iterative EST method. The algorithm iterates back and forth between Fourier and object space. In each iteration, the calculated slices are updated with the measured (experimental) slices in Fourier space and the physical constraints are enforced in object space.
Figure 3
Figure 3
Convergence of the iterative algorithm, showing the steady decrease of the R-factor as a function of the number of iteration.
Figure 4
Figure 4
Quantitative comparisons between the EST, WBP, ART and SART reconstructions. (a) Average cross-correlation coefficients and standard deviations of 20 KLH particles reconstructed by EST of 105 projections (EST-full), EST of 70 projections (EST-2/3), WBP of 105 projections (WBP-full), WBP of 70 projections (WBP-2/3), ART of 105 projections (ART-full) and SART 105 projections (ART-full), respectively. (b) Average Fourier shell correction curves of the reconstructed KLH particles. The EST reconstruction obtained with just two-thirds of the images appears to have essentially the same resolution as the WBP reconstruction.
Figure 4
Figure 4
Quantitative comparisons between the EST, WBP, ART and SART reconstructions. (a) Average cross-correlation coefficients and standard deviations of 20 KLH particles reconstructed by EST of 105 projections (EST-full), EST of 70 projections (EST-2/3), WBP of 105 projections (WBP-full), WBP of 70 projections (WBP-2/3), ART of 105 projections (ART-full) and SART 105 projections (ART-full), respectively. (b) Average Fourier shell correction curves of the reconstructed KLH particles. The EST reconstruction obtained with just two-thirds of the images appears to have essentially the same resolution as the WBP reconstruction.
Figure 5
Figure 5
Power spectra of a KLH particle reconstructed by (a) EST, (b) WBP, (c) ART and (d) SART, respectively. Compared to the WBP, ART and SART power spectra, the EST spectrum is more continuous and smoother as the missing wedge region is filled in with some structural information by the iterative algorithm. Note that the WBP reconstruction employed a low-pass filter with a Gaussian fall-off starting at a spatial frequency of 0.29 nm−1 (Mastronarde, 1997).
Figure 6
Figure 6
Three 13.4-nm-thick slices along the XY, YZ and XZ planes of a KLH particle reconstructed by (a) WBP-full, (b) EST-full, (c) WBP-2/3 and (d) EST-2/3, respectively. The EST reconstructions show higher contrast, more easily detectable molecular boundaries and reduced noise.
Figure 7
Figure 7
Iso-surfaces shown in 3 different orientations for (a) the known higher resolution model, (b) WBP-full, (c) WBP-full-denoising, (d) EST-full, (e) WBP-2/3, (f) WBP-2/3-denoising and (g) EST-2/3 reconstructions of a KLH particle. Compared with WBP, the EST reconstructions show less peripheral noise, more easily detectable molecular boundaries and more continuous density. The arrows indicate regions where EST has alleviated the missing wedge effect.
Figure 8
Figure 8
3D reconstructions of a frozen-hydrated spirillum cell. (a), (b) and (c) represent 3 6.7-nm-thick slices in the XY, XZ and YZ plane of the WBP reconstruction. (e), (f) and (g) are the same three orthogonal slices obtained by EST. (d) and (h) are the zoom-in view of a nucleoid region. Compared with the WBP reconstruction, the EST reconstruction exhibits higher resolution, higher contrast, less peripheral noise, more easily detectable boundaries and reduced missing wedge effects.

References

    1. Averbuch A, Coifman R, Donoho D, Israeli M, Shkolnisky Y. A Framework for Discrete Integral Transformations I – the Pseudopolar Fourier Transform. SIAM J. Sci. Comput. 2008;30:764–784.
    1. Brenner DJ, Hall EJ. Computed Tomography — An Increasing Source of Radiation Exposure. N. Eng. J. Med. 2007;357:2277–2284. - PubMed
    1. Briggs WL, Henson VE. The DFT: An Owners' Manual for the Discrete Fourier Transform. SIAM; Philadelphia: 1995.
    1. Castano Diez D, Mueller H, Frangakis AS. Implementation and performance evaluation of reconstruction algorithms on graphics processors. J. Struct. Biol. 2007;157:288–295. - PubMed
    1. De Rosier DJ, Klug A. Reconstruction of Three Dimensional Structures from Electron Micrographs. Nature. 1968;217:130–134. - PubMed

Publication types

MeSH terms