. 2008 Nov 15;43(3):554-61.
doi: 10.1016/j.neuroimage.2008.07.063. Epub 2008 Aug 15.

Measuring brain connectivity: diffusion tensor imaging validates resting state temporal correlations

Affiliations

Measuring brain connectivity: diffusion tensor imaging validates resting state temporal correlations

Pawel Skudlarski et al. Neuroimage. .

Abstract

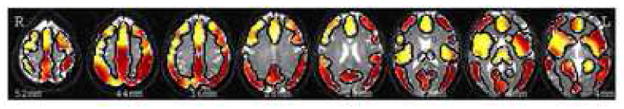
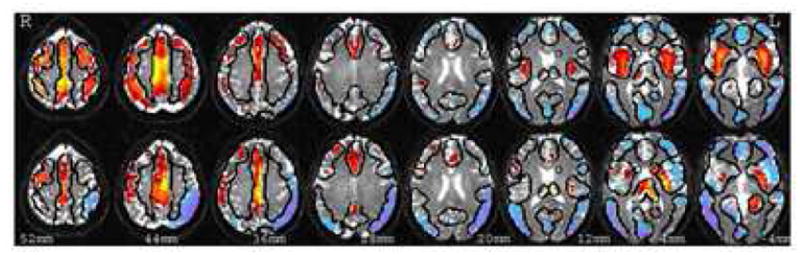
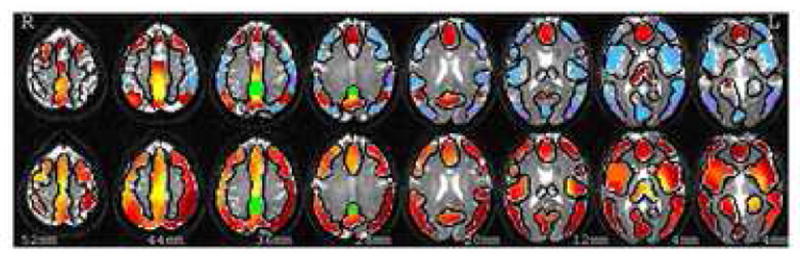
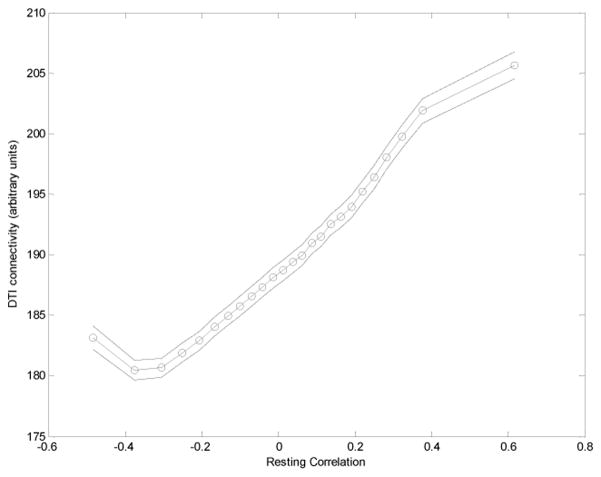
Diffusion tensor imaging (DTI) and resting state temporal correlations (RSTC) are two leading techniques for investigating the connectivity of the human brain. They have been widely used to investigate the strength of anatomical and functional connections between distant brain regions in healthy subjects, and in clinical populations. Though they are both based on magnetic resonance imaging (MRI) they have not yet been compared directly. In this work both techniques were employed to create global connectivity matrices covering the whole brain gray matter. This allowed for direct comparisons between functional connectivity measured by RSTC with anatomical connectivity quantified using DTI tractography. We found that connectivity matrices obtained using both techniques showed significant agreement. Connectivity maps created for a priori defined anatomical regions showed significant correlation, and furthermore agreement was especially high in regions showing strong overall connectivity, such as those belonging to the default mode network. Direct comparison between functional RSTC and anatomical DTI connectivity, presented here for the first time, links two powerful approaches for investigating brain connectivity and shows their strong agreement. It provides a crucial multi-modal validation for resting state correlations as representing neuronal connectivity. The combination of both techniques presented here allows for further combining them to provide richer representation of brain connectivity both in the healthy brain and in clinical conditions.


Figures

Figure 1
Figure 1
Map of the correlation between Resting State and anatomical connectivity maps. Each activated voxel represents a seed for which anatomical and functional originating connectivity maps are significantly similar. Red color represents voxels at p<0.05 and yellow p<0.001. Most of gray matter is found to seed connectivity maps that agree significantly. In this and following figure the Talairach slices presented are at z= 52 to −4 mm, with skip of 8mm.
Figure 2
Figure 2
Maps of mean connectivity (voxel intensity shows average of connectivity measure between this voxel and all other gray matter voxels). The upper row represents functional connectivity calculated from resting state correlations. Significance was estimated from between-subject variance p<0.001. The lower row represents the (positively defined) anatomical connectivity normalized to zero mean for better comparison.
Figure 3
Figure 3
This illustrates connectivity maps for the posterior cingulate cortex (PCC). The top row represents the functional map based on the resting correlation analysis thresholded at p<0.001 (uncorrected). The bottom row shows the strength of anatomical connectivity estimated using DTI tractography. The connection between vACC and PCC can be seen in both maps. Green color represents the seed region.
Figure 4
Figure 4
Mean DTI estimated anatomical connectivity as a function of mean functional resting state connectivity. The whole connectivity matrix was divided based in the resting connectivity values into 25 bins The average value of DTI connectivity of each of those bins is plotted against mean resting connectivity. It is apparent that anatomical connectivity (measured by DTI) increases for most of the range, with exception of the lowest resting connectivity bin. This suggests that it is the resting connectivity and not its absolute value that corresponds to the actual functional connectivity, that negative resting connectivity should not be interpreted as representing real functional connectivity.

References

    1. Biswal B, et al. FUNCTIONAL CONNECTIVITY IN THE MOTOR CORTEX OF RESTING HUMAN BRAIN USING ECHO-PLANAR MRI. Magnetic Resonance in Medicine Magn Reson Med. 1995;34(4):537–541. - PubMed
    1. Lowe MJ, et al. Correlations in low-frequency BOLD fluctuations reflect cortico-cortical connections. Neuroimage. 2000;12(5):582–587. - PubMed
    1. Hampson M, et al. Detection of functional connectivity using temporal correlations in MR images. Human Brain Mapping Hum Brain Mapp. 2002;15(4):247–262. - PMC - PubMed
    1. Hampson M, et al. Brain connectivity related to working memory performance. Journal of Neuroscience J Neurosci. 2006;26(51):13338–13343. - PMC - PubMed
    1. Greicius MD, et al. Functional connectivity in the resting brain: A network analysis of the default mode hypothesis. Proceedings of the National Academy of Sciences of the United States of America Proc Natl Acad Sci U S A. 2003;100(1):253–258. - PMC - PubMed

Publication types