. 2008 Sep;83(3):388-400.
doi: 10.1016/j.ajhg.2008.08.012. Epub 2008 Sep 4.

DYRK1A-dosage imbalance perturbs NRSF/REST levels, deregulating pluripotency and embryonic stem cell fate in Down syndrome

Affiliations

DYRK1A-dosage imbalance perturbs NRSF/REST levels, deregulating pluripotency and embryonic stem cell fate in Down syndrome

Claudia Canzonetta et al. Am J Hum Genet. 2008 Sep.

Abstract

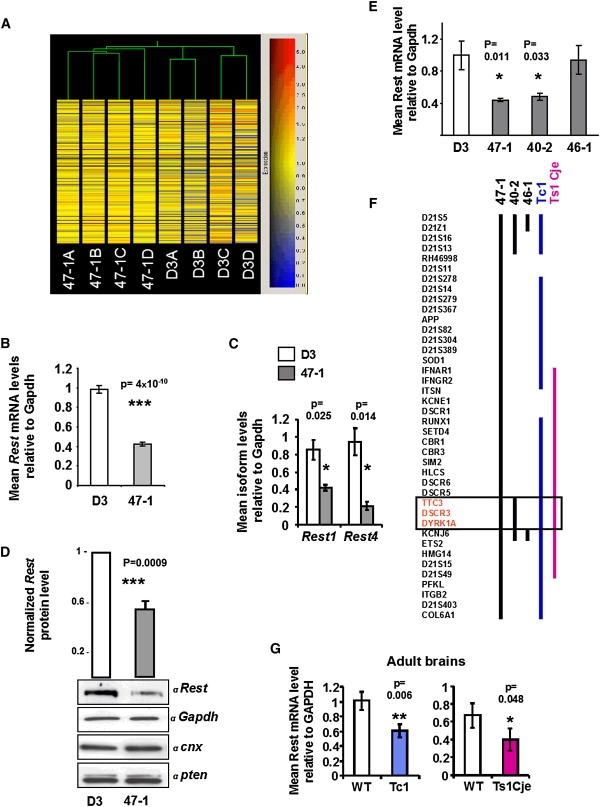
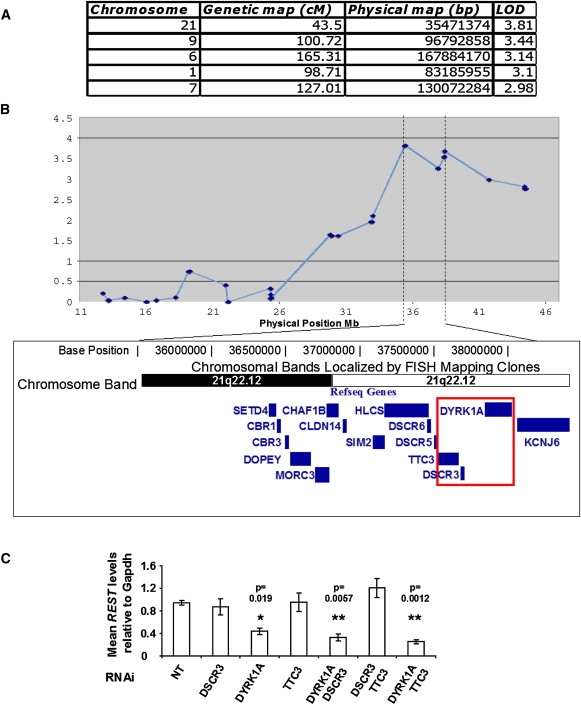
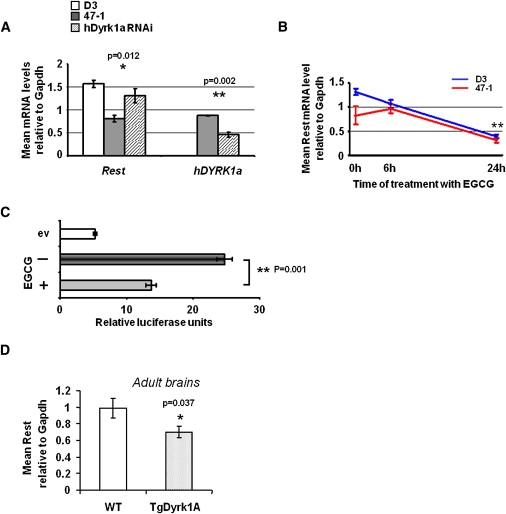
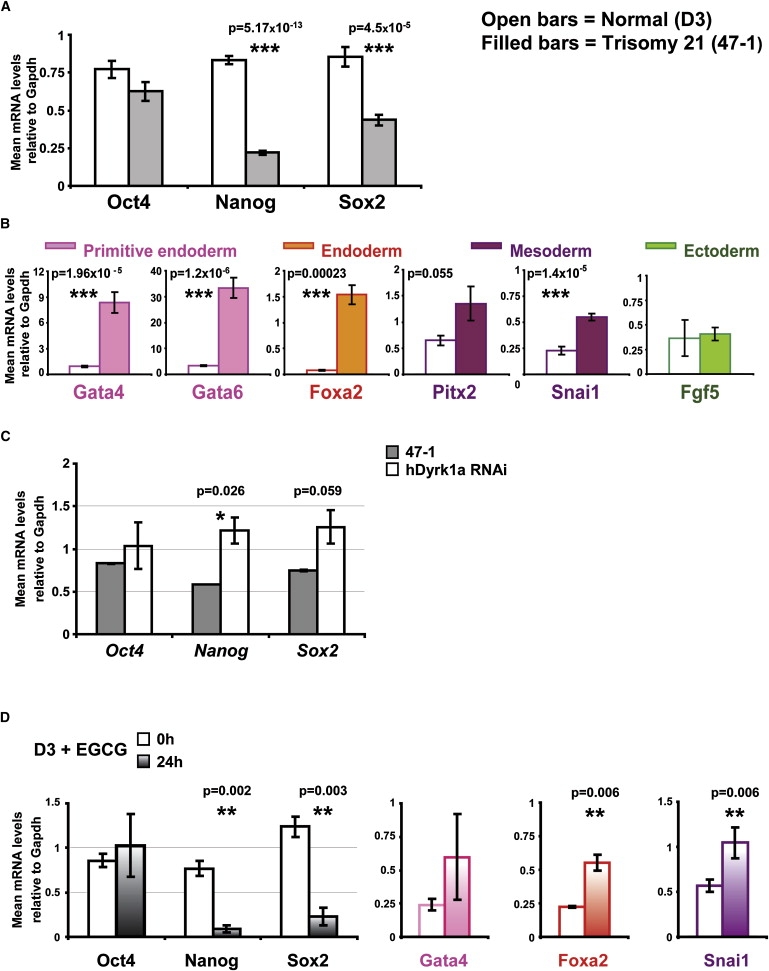
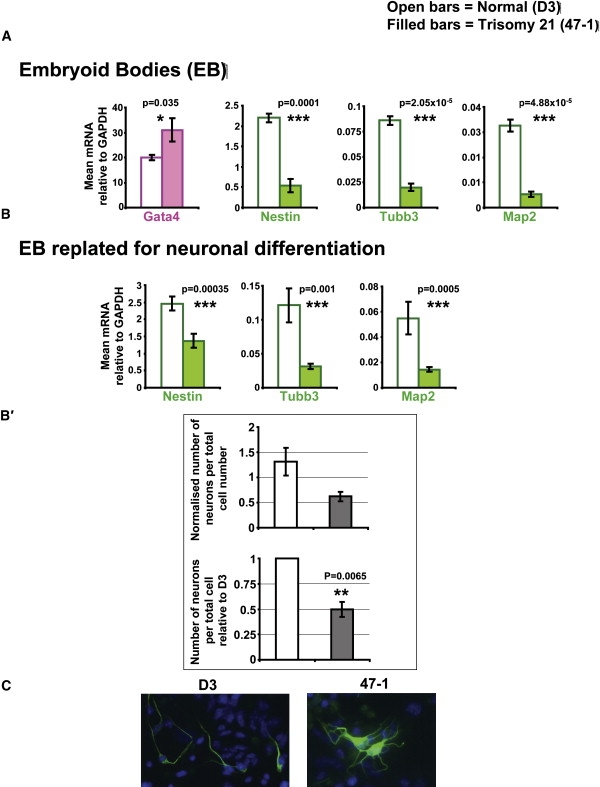
Down syndrome (DS) is the most common cause of mental retardation. Many neural phenotypes are shared between DS individuals and DS mouse models; however, the common underlying molecular pathogenetic mechanisms remain unclear. Using a transchromosomic model of DS, we show that a 30%-60% reduced expression of Nrsf/Rest (a key regulator of pluripotency and neuronal differentiation) is an alteration that persists in trisomy 21 from undifferentiated embryonic stem (ES) cells to adult brain and is reproducible across several DS models. Using partially trisomic ES cells, we map this effect to a three-gene segment of HSA21, containing DYRK1A. We independently identify the same locus as the most significant eQTL controlling REST expression in the human genome. We show that specifically silencing the third copy of DYRK1A rescues Rest levels, and we demonstrate altered Rest expression in response to inhibition of DYRK1A expression or kinase activity, and in a transgenic Dyrk1A mouse. We reveal that undifferentiated trisomy 21 ES cells show DYRK1A-dose-sensitive reductions in levels of some pluripotency regulators, causing premature expression of transcription factors driving early endodermal and mesodermal differentiation, partially overlapping recently reported downstream effects of Rest +/-. They produce embryoid bodies with elevated levels of the primitive endoderm progenitor marker Gata4 and a strongly reduced neuroectodermal progenitor compartment. Our results suggest that DYRK1A-mediated deregulation of REST is a very early pathological consequence of trisomy 21 with potential to disturb the development of all embryonic lineages, warranting closer research into its contribution to DS pathology and new rationales for therapeutic approaches.


Figures

Figure 1
Figure 1
Transcript Profiling and Analysis of Rest Levels in Down Syndrome Model Systems (A) Unsupervised clustering of transchromosomic (+HSA21) 47-1 and normal control D3 mouse ES cell lines. RNA samples from four cultures of each cell line were analyzed independently on Affymetrix MG-U74Av2 arrays, and hierarchical clustering based on Spearman correlation was performed, after elimination of all probe sets called absent across all chips. (B) qRT-PCR measurement of the level of Rest transcript in undifferentiated ES cells (n = 9 independent cultures). (C) qRT-PCR analysis of alternative forms of the Rest transcript (Rest-1 and Rest-4) in undifferentiated ES cells (n = 4). (D) Western blot of Rest protein expression in undifferentiated ES cells. Bars show densitometric intensity of the Rest band, normalized against each of the three normalizing protein bands (shown below) and averaged across values obtained from three independent cell cultures for each normalization. (E) qRT-PCR analysis of Rest in partially trisomic transchromosomic ES lines 40-2 and 46-1, compared with D3 and 47-1 (n = 4). (F) Map showing regions of HSA21 that are trisomic (black bar indicates HSA21 fragments [mapping data based on refs. , Table S5, and unpublished data]; red bar indicates equivalent mouse chromosome 16 segment5) in trisomy 21 models. The box delineates the minimal trisomic region correlating with Rest suppression. (G) qRT-PCR analysis of Rest in adult brains of Tc1 mice and their WT littermates (n = 5) and in adult brains of Ts1Cje mice and their WT littermates (n = 6). In all graphs, means and standard errors are shown, and statistical significance by Student's t test is indicated by one (p < 0.05), two (p < 0.01), or three (p < 0.001) asterisks.
Figure 2
Figure 2
Rest Levels Are Controlled by the DYRK1A Genomic Locus in Human Cells and Are Sensitive to DYRK1A Levels in Normal Mouse Cells (A) Table showing most significant human genome-wide eQTLs for REST expression levels. The four columns show the chromosome where the peak is located, the genetic map position of the SNP marker with the highest LOD score, its physical position according to the hg17 assembly, and the corresponding LOD score, respectively. (B) Results of multipoint REST eQTL analysis of HSA21. Dotted lines show the interval of most significant linkage genome-wide and the corresponding annotated gene content derived from the UCSC genome browser. The highlighted box indicates overlap with the common trisomic region identified by segmental models in Figure 1F. (C) Individual and combination gene-by-gene dissection of the candidate overlap region with the use of RNAi silencing in normal mouse E14 ES cells. The RNAi targets are indicated along the horizontal axis, and the vertical bars show the qRT-PCR levels for Rest (n = 3 independent transfection experiments). The specificity and efficiency of silencing is shown in Figure S3. Data are shown normalized to control samples transfected with a nontargeting “scrambled” RNAi sequence. Means and standard errors are shown, and statistical significance by Student's t test is indicated by one (p < 0.05) or two (p < 0.01) asterisks.
Figure 3
Figure 3
Trisomy of DYRK1A Reduces Rest mRNA Levels in Mouse Models of DS (A) qRT-PCR analysis of Rest and human DYRK1A levels in undifferentiated mouse ES cells: D3 (open bars), 47-1 (filled bars), and 47-1 transfected with RNAi specifically targeting human DYRK1A mRNA in the 3′UTR (striped bars) (n = 3 independent transfection experiments). The data are shown relative to control samples transfected with nontargeting “scrambled” RNAi sequence. (B) qRT-PCR analysis of Rest levels in undifferentiated mouse D3 and 47-1 ES cells (blue symbols and red symbols, respectively) treated with the DYRK1A-kinase inhibitor, green-tea compound EGCG (10 μM), for 0, 6, or 24 hr. (C) Undifferentiated D3 mouse ES cells were transfected with a construct containing 1013 bp of mouse Rest promoter sequence cloned upstream of a firefly luciferase reporter gene and were then treated (+) or not treated (−) with 10 μM EGCG for 24 hr (ev: cells transfected with empty vector, containing the luciferase gene without any promoter). Horizontal bars represent arbitrary luminescence units. Firefly luminescence was normalized against Renilla luciferase activity for taking into account transfection efficiency (n = 3 independent transfection experiments). (D) qRT-PCR analysis of Rest in adult brains of TgDyrk1A mice and WT littermates (n = 5). Means and standard errors are shown, and statistical significance by Student's t test is indicated by one (p < 0.05) or two (p < 0.01) asterisks.
Figure 4
Figure 4
Trisomy 21-Caused Perturbation of the Regulatory Network Maintaining Pluripotency in Undifferentiated ES Cells Is Sensitive to DYRK1A Activity (A) qRT-PCR measurements of the mRNA levels of key regulators of pluripotency in undifferentiated D3 (open bars) and 47-1 (filled bars) mouse ES cells (n = 9). (B) qRT-PCR measurements of the mRNA levels of selected differentiation-driving TFs that are known downstream targets of the regulators of pluripotency. TFs driving specific embryonic-layer lineages are color coded, as per labeled color symbols. D3 (open bars) and 47-1 (filled bars) (n = 9). (C) qRT-PCR analysis of Sox2 and Nanog levels in undifferentiated mouse ES cells: 47-1 (filled bars) and 47-1 transfected with RNAi specifically targeting human DYRK1A mRNA in the 3′UTR (open bars) (n = 3 independent transfection experiments). The data are shown relative to the control samples transfected with nontargeting “scrambled” RNAi sequence. (D) qRT-PCR analysis of the levels of regulators of pluripotency and selected lineage-specific TFs in undifferentiated normal mouse D3 cells treated with the DYRK1A-kinase inhibitor, green-tea compound EGCG (10 μM), for 0 hr (open symbols) or 24 hr (reverse striped symbols). TFs driving specific embryonic-layer lineages are color coded, as per labeled color symbols. In all graphs, means and standard errors are shown, and statistical significance by Student's t test is indicated by one (p < 0.05), two (p < 0.01), or three (p < 0.001) asterisks.
Figure 5
Figure 5
Trisomy 21 ES Cells Give Rise to Embryoid Bodies with a Disturbed Composition of Lineage-Specific Progenitors (A) qRT-PCR measurements of the mRNA levels of selected lineage-specific markers in EBs derived by culturing D3 (open bars) and 47-1 (filled bars) ES cells (n = 8 experiments) in the absence of LIF, as well as in the presence of retinoic acid. Markers of specific embryonic-layer lineages are color coded, as in Figure 4. (B and B′) Measurement of the progress of in vitro neurogenesis of EBs from Figure 5A replated onto Neurobasal N2 medium for promoting the differentation of neural progenitors into neurons. (B) mRNA levels of Nestin, Map2, and Tubb3, measured by qRT-PCR (n = 7 experiments). (B′) Proportion of cells positive for immunofluorescent staining with a neuronal marker, relative to the number of DAPI-staining nuclei (n = 2 experiments). Lower graph shows values normalized to WT D3 levels. (C) Representative immunofluorescence images of Tubb3-positive (green) cells derived from EBs of D3 and 47-1 cells after differentiation for 48 hr in Neurobasal N2 medium, with DAPI (blue) nuclear counterstain. See Figure S5 for quantitative analysis of neurite branching. In all graphs, means and standard errors are shown, and statistical significance by Student's t test is indicated by one (p < 0.05), two (p < 0.01), or three asterisks (p < 0.001).

Similar articles

Cited by

References

    1. Epstein C. Down Syndrome. In: Scriver C.R.B.A., Sly W.S., Valle D., editors. The metabolic and molecular bases of inherited disease. McGraw-Hill; New York: 2001. pp. 1223–1256.
    1. Antonarakis S.E., Lyle R., Dermitzakis E.T., Reymond A., Deutsch S. Chromosome 21 and down syndrome: from genomics to pathophysiology. Nat. Rev. Genet. 2004;5:725–738. - PubMed
    1. Reeves R.H., Irving N.G., Moran T.H., Wohn A., Kitt C., Sisodia S.S., Schmidt C., Bronson R.T., Davisson M.T. A mouse model for Down syndrome exhibits learning and behaviour deficits. Nat. Genet. 1995;11:177–184. - PubMed
    1. Smith D.J., Stevens M.E., Sudanagunta S.P., Bronson R.T., Makhinson M., Watabe A.M., O'Dell T.J., Fung J., Weier H.U., Cheng J.F. Functional screening of 2 Mb of human chromosome 21q22.2 in transgenic mice implicates minibrain in learning defects associated with Down syndrome. Nat. Genet. 1997;16:28–36. - PubMed
    1. Sago H., Carlson E.J., Smith D.J., Kilbridge J., Rubin E.M., Mobley W.C., Epstein C.J., Huang T.T. Ts1Cje, a partial trisomy 16 mouse model for Down syndrome, exhibits learning and behavioral abnormalities. Proc. Natl. Acad. Sci. USA. 1998;95:6256–6261. - PMC - PubMed

Publication types

MeSH terms

Substances