. 2008 Sep 9;14(3):201-11.
doi: 10.1016/j.ccr.2008.06.017.

Calcification of multipotent prostate tumor endothelium

Affiliations

Calcification of multipotent prostate tumor endothelium

Andrew C Dudley et al. Cancer Cell. .

Abstract

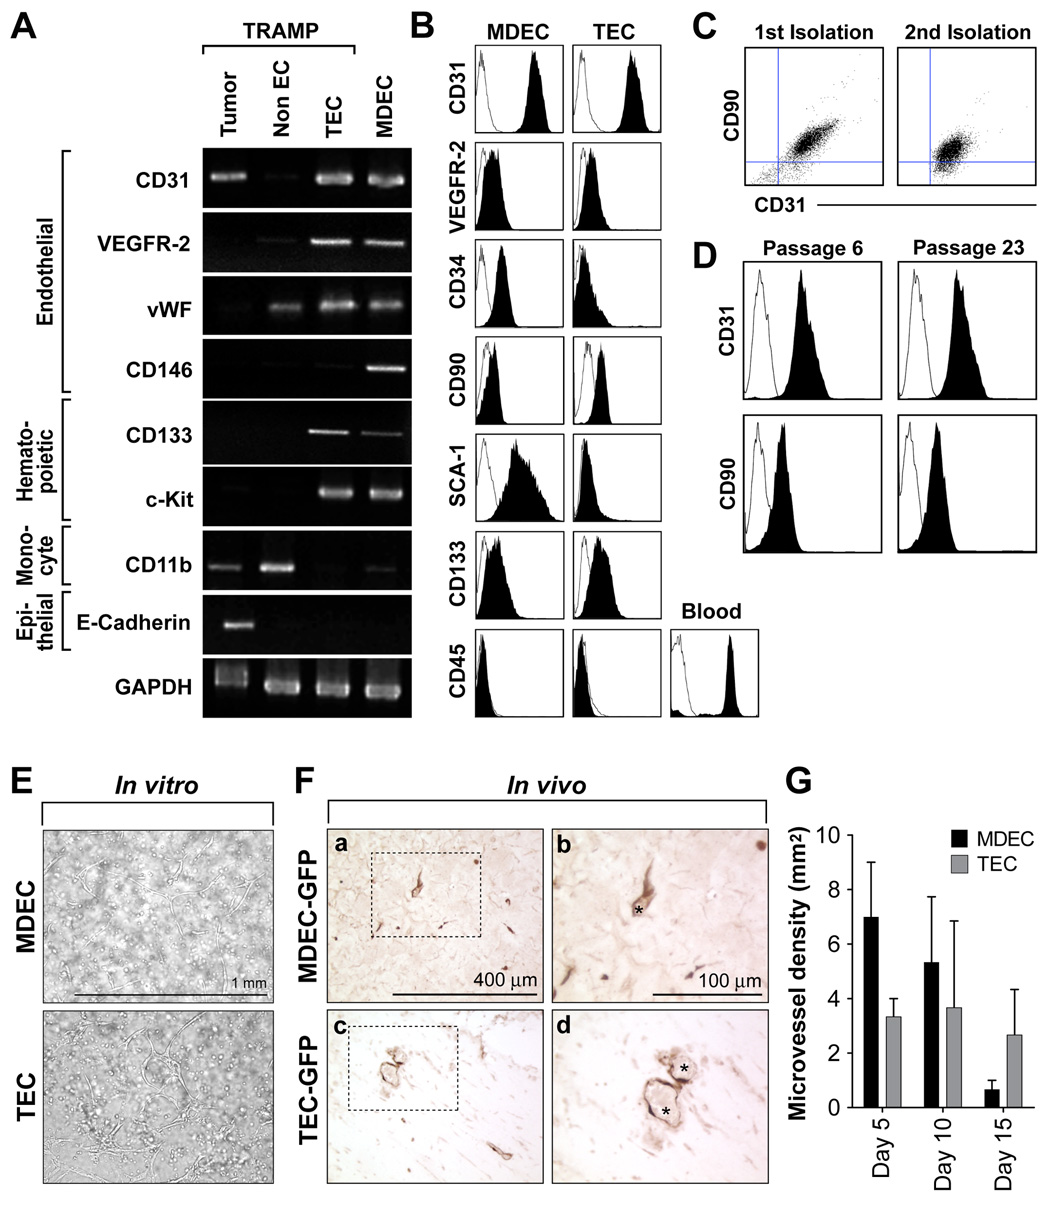
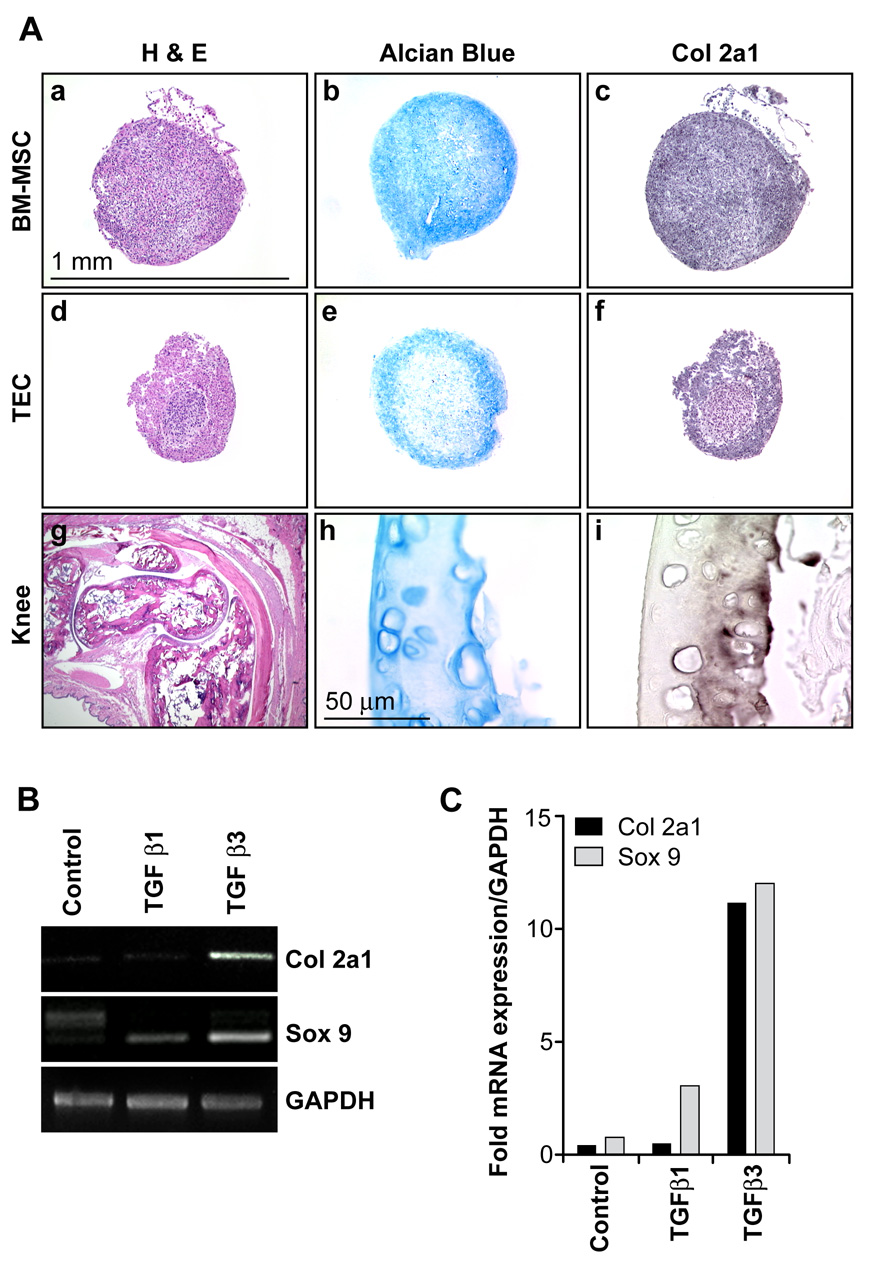
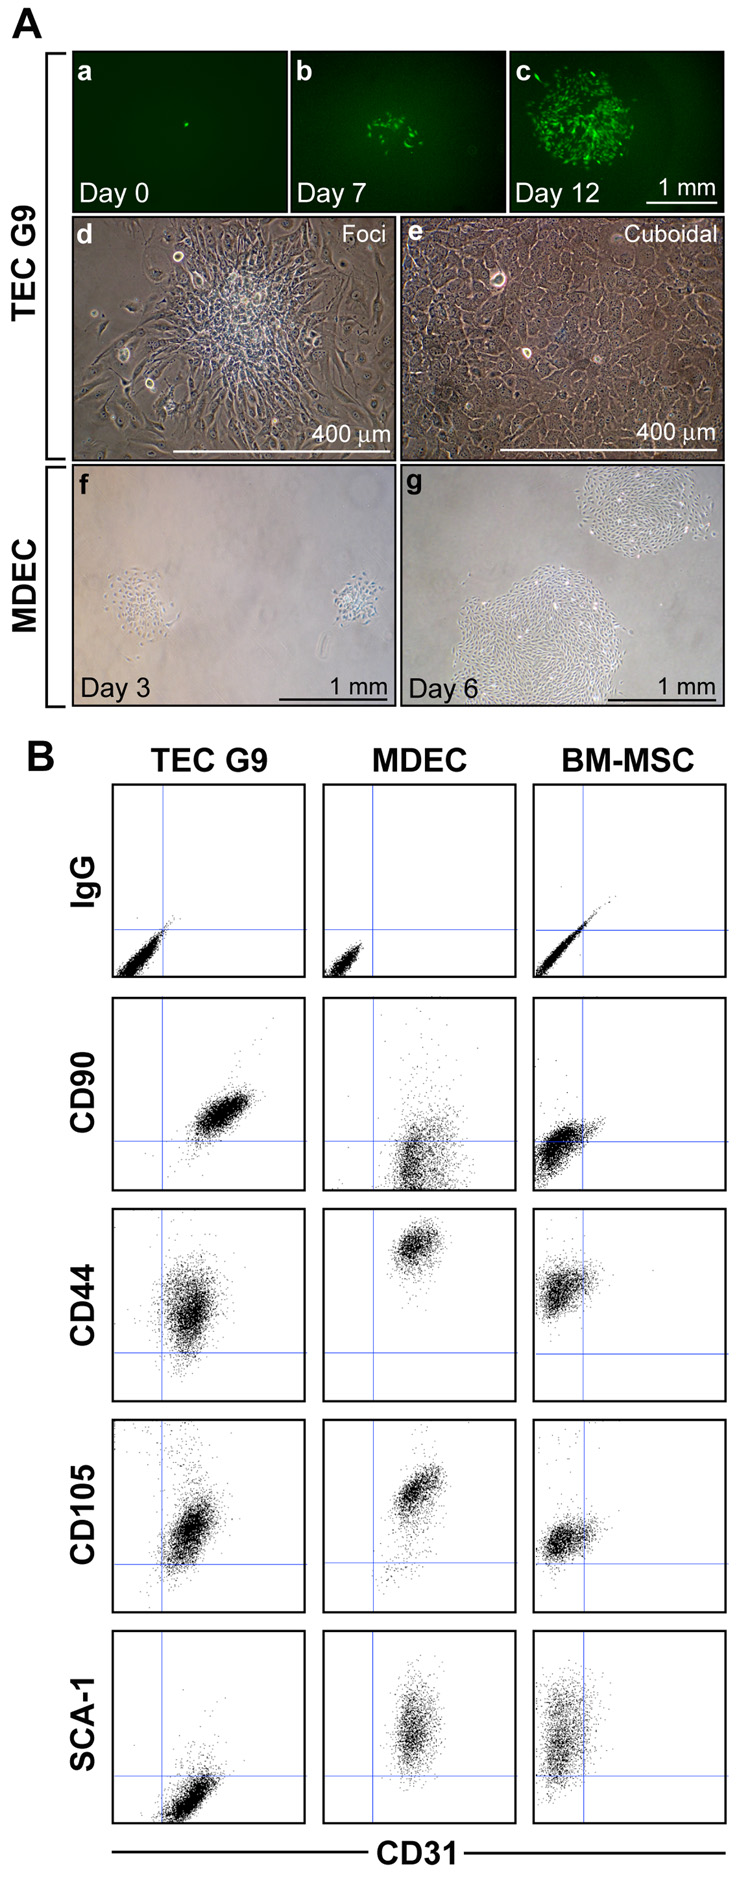
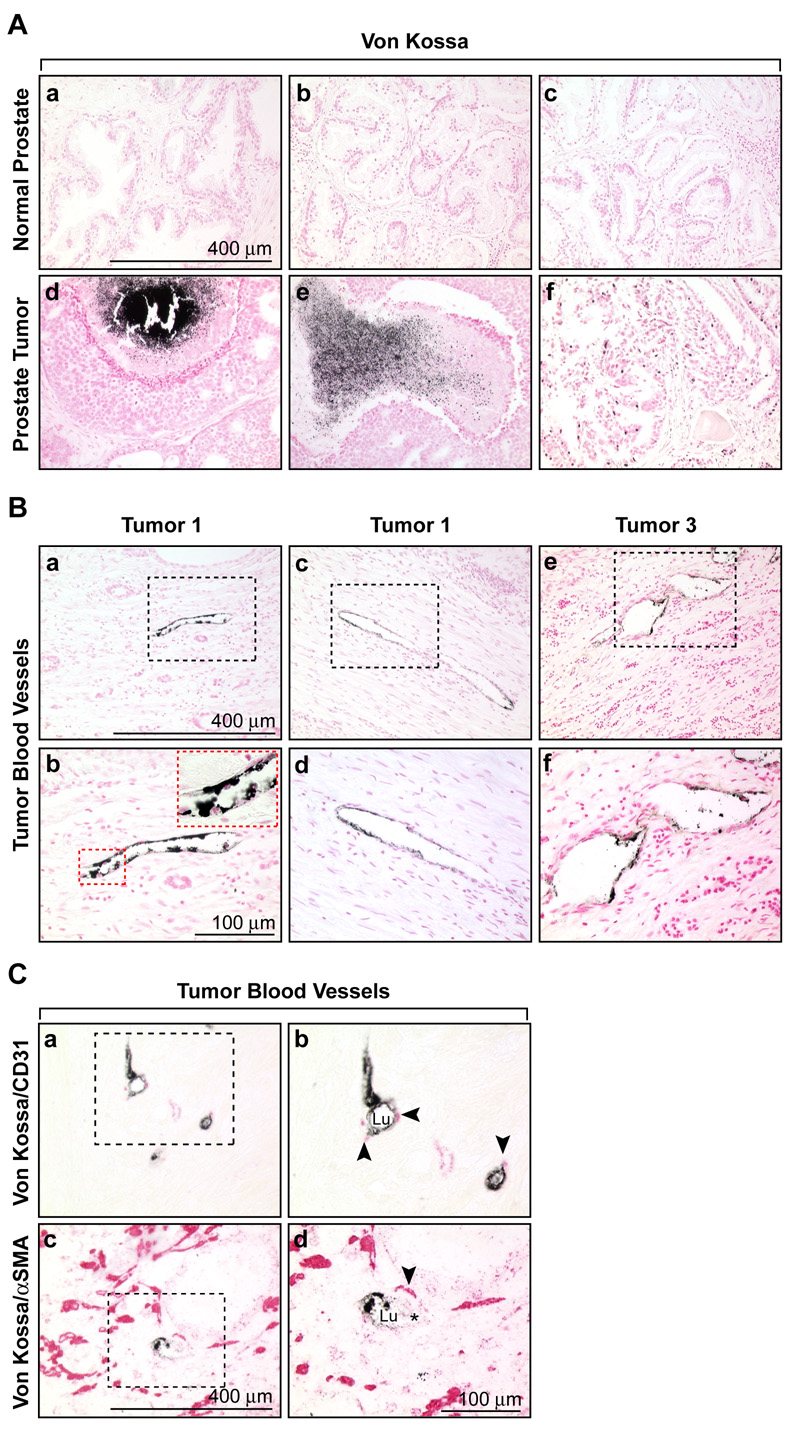
Solid tumors require new blood vessels for growth and metastasis, yet the biology of tumor-specific endothelial cells is poorly understood. We have isolated tumor endothelial cells from mice that spontaneously develop prostate tumors. Clonal populations of tumor endothelial cells expressed hematopoietic and mesenchymal stem cell markers and differentiated to form cartilage- and bone-like tissues. Chondrogenic differentiation was accompanied by an upregulation of cartilage-specific col2a1 and sox9, whereas osteocalcin and the metastasis marker osteopontin were upregulated during osteogenic differentiation. In human and mouse prostate tumors, ectopic vascular calcification was predominately luminal and colocalized with the endothelial marker CD31. Thus, prostate tumor endothelial cells are atypically multipotent and can undergo a mesenchymal-like transition.


Figures

Figure 1
Figure 1. TEC express markers of and function as bona fide endothelium
(A) Isolated TEC and MDEC (both passage 6) were analyzed for marker expression by RT-PCR. The un-fractioned tumor and the CD31 non-EC fractions from the purification step were also included on the gel. (B) FACS demonstrating uniform staining for the selected markers in MDEC and TEC. (C) FACS analysis of CD31+/CD90+ TEC from two separate isolations. Three to four tumors were pooled in each example and the EC were isolated and expanded in culture as described. (D) The CD31+/CD90+ phenotype was stable and was observable after prolonged culture. (E) Both MDEC and TEC formed tube-like structures in a three-dimensional matrigel culture system in vitro. (F) GFP-tagged MDEC and TEC formed functional blood vessels when injected in vivo. Matrigel plugs from day 10 were stained with anti-GFP antibodies (a–d). The staining shows the luminal position of the labeled EC (dark brown staining). The boxed regions are shown at higher magnification at right. Visible erythrocytes within the vessels are marked with an asterisk (*). (G) Microvessel density over time (n= 3 mice per group). Error bars are +/− SEM.
Figure 2
Figure 2. TEC form mesenchymal-like foci in vitro and demonstrate alkaline phosphatase activity when cultured in osteogenic medium
(A) Foci in TEC and BM-MSC were counted and averaged from two, 10 cm2 culture dishes. Error bars are +/− SEM. (B) The morphology of TEC foci was cuboidal (a,b) with no overlap between adjacent cells, while BM-MSC were spindle-shaped with overlapping borders (c,d). The boxed regions are shown in higher magnification at right. (C) BM-MSC underwent adipogenic differentiation (a) and up-regulated ALP activity (b) after culture in adipogenic or osteogenic medium, respectively. TEC did not undergo adipogenic differentiation (c) but did show an up-regulation of ALP activity in osteogenic medium (d). MDEC did not differentiate under any test conditions (e,f). In ‘c, e, and f’ the nuclei were counterstained with hematoxylin. (D) The percentage of positive cells from 10 fields were quantified and plotted on the graph. Error bars are +/− SEM.
Figure 3
Figure 3. TEC undergo mineralization after prolonged culture in osteogenic medium
(A) MDEC were negative for Von Kossa staining in control and osteogenic medium after a two (a,c) or three-week incubation (b,d). TEC were also Von Kossa negative after the two-week incubation (e,g). But intense Von Kossa staining, indicating calcification, was present in TEC after three weeks (f,h). The nuclei were counterstained with hematoxylin. (B,C) Late markers of osteogenic differentiation, osteopontin and osteocalcin were up-regulated about 3-fold in TEC after three weeks in osteogenic medium.
Figure 4
Figure 4. Chondrogenic differentiation of TEC
(A) BM-MSC and TEC formed a visible pellet within 3–4 days which was maintained for the two week experiment. Formalin-fixed, paraffin-embedded pellets were sectioned and stained with H&E (a,d), alcian blue (b,e), or col 2a1 antibodies (c,f). An H & E-stained section of mouse leg is also shown (g). Articular cartilage around the mouse knee stained specifically with alcian blue (h) and col 2a1 (i). The one mm scale bar applies to panels ‘a–g’, the 50 µM scale bar to panels ‘h–i’. (B,C) Markers of chondrogenic differentiation, col 2a1 and sox 9, were up-regulated in TEC about 12-fold in the presence of TGFβ3. No pellet was formed in TEC when TGFβ1 was substituted.
Figure 5
Figure 5. TEC can be grown as single cell clones
(A) TEC infected with retroviral GFP were plated as single cells in 96-well plates. While most single cells never proliferated, occasional colonies could be obtained from single cells (a) that proliferated into clonal populations seven days (b) and 12 days (c) after seeding. TEC clone G9 obtained by limiting dilution formed foci (d) and highly proliferative, cuboidal-shaped cells (e). Single cell clones could not be obtained in MDEC by limiting dilution. But sparsely plated MDEC readily formed colonies which could be selected using cloning rings. MDEC three (f) and six (g) days after initial plating, but before selection using cloning rings. (B) Flow cytometry was carried out on live cells using the indicated antibodies. Consistent with the parental TEC, clone G9 co-expressed CD90 and CD31. Additional mesenchymal markers, CD44 and CD105 were also present while SCA-1 was absent in TEC. A colony of MDEC selected using cloning rings expressed CD31 in addition to CD44, CD105, and SCA-1 but CD90 was low to absent. BM-MSC expressed all markers with the exception of CD31.
Figure 6
Figure 6. Single cell clones of TEC undergo osteogenic and chondrogenic differentiation
(A) After three weeks in osteogenic medium, clone G9 was fixed and stained with Von Kossa solution. Brownish/black staining in G9 (a) and BM-MSC (b) was evident, indicating calcification. Chondrogenic differentiation was also observed in clone G9 (c) and BM-MSC (d), indicated by a visible pellet after two weeks in chondrogenic medium which stained with alcian blue. In adipogenic medium, no Oil-Red-O positive cells were observed in clone G9 (e), in contrast to BM-MSC (f). (B) Semi- quantitative RT-PCR analysis for differentiation markers in each cell type cultured in the indicated differentiation medium. The asterisk (*) indicates that 5 % serum was included in the chondrogenic medium because MDEC did not survive in the serum-free conditions. (C) Col 2a1 and osteopontin, but not PPARγ2 were inducible in an additional TEC clone (A2) cultured in differentiation media.
Figure 7
Figure 7. In vivo calcification of prostate tumor cells and vascular cells
(A) Representative images of Von Kossa staining in normal prostate (a,b,c) and prostate tumors (d,e,f). Calcification in tumors was often associated with highly necrotic regions. (B) Von Kossa staining in tumor blood vessels from three different tumors showing the luminal localization (a,c,e). Boxed regions are shown in higher magnification below (b,d,f). The inset in panel ‘b’ shows a higher magnification of the boxed region. Nuclei in ‘A’ and ‘B’ were counterstained with nuclear fast red. (C) Co-localization of the endothelial marker, CD31 (a,b) and the pericyte marker, α SMA (c,d) with Von Kossa staining in tumor blood vessels. The boxed regions are shown in higher magnification at right. CD31 and α SMA were detected using an alkaline phosphatase-conjugated secondary antibody and appear red in the figure. No counterstain was used. Lu = lumen and the asterisk (*) marks a visible erythrocyte within the vessel lumen in ‘d’.

Comment in

References

    1. Allan AL, George R, Vantyghem SA, Lee MW, Hodgson NC, Engel CJ, Holliday RL, Girvan DP, Scott LA, Postenka CO, et al. Role of the integrin-binding protein osteopontin in lymphatic metastasis of breast cancer. Am J Pathol. 2006;169:233–246. - PMC - PubMed
    1. Amin DN, Hida K, Bielenberg DR, Klagsbrun M. Tumor endothelial cells express epidermal growth factor receptor (EGFR) but not ErbB3 and are responsive to EGF and to EGFR kinase inhibitors. Cancer Res. 2006;66:2173–2180. - PubMed
    1. Baluk P, Hashizume H, McDonald DM. Cellular abnormalities of blood vessels as targets in cancer. Curr Opin Genet Dev. 2005;15:102–111. - PubMed
    1. Bertolini F, Shaked Y, Mancuso P, Kerbel RS. The multifaceted circulating endothelial cell in cancer: towards marker and target identification. Nat Rev Cancer. 2006;6:835–845. - PubMed
    1. Bussolati B, Bruno S, Grange C, Buttiglieri S, Deregibus MC, Cantino D, Camussi G. Isolation of renal progenitor cells from adult human kidney. Am J Pathol. 2005;166:545–555. - PMC - PubMed

Publication types

MeSH terms