. 2008 Nov 14;283(46):32014-23.
doi: 10.1074/jbc.M804828200. Epub 2008 Sep 4.

Acanthamoeba myosin IC colocalizes with phosphatidylinositol 4,5-bisphosphate at the plasma membrane due to the high concentration of negative charge

Affiliations

Acanthamoeba myosin IC colocalizes with phosphatidylinositol 4,5-bisphosphate at the plasma membrane due to the high concentration of negative charge

Hanna Brzeska et al. J Biol Chem. .

Abstract

The tail of Acanthamoeba myosin IC (AMIC) has a basic region (BR), which contains a putative pleckstrin homology (PH) domain, followed by two Gly/Pro/Ala (GPA)-rich regions separated by a Src homology 3 (SH3) domain. Cryoelectron microscopy had shown that the tail is folded back on itself at the junction of BR and GPA1, and nuclear magnetic resonance spectroscopy indicated that the SH3 domain may interact with the putative PH domain. The BR binds to acidic phospholipids, and the GPA region binds to F-actin. We now show that the folded tail does not affect the affinity of AMIC for acidic phospholipids. AMIC binds phosphatidylinositol 4,5-bisphosphate (PIP2) with high affinity (approximately 1 microm), but binding is not stereospecific. When normalized to net negative charge, AMIC binds with equal affinity to phosphatidylserine (PS) and PIP2. This and other data show that the putative PH domain of AMIC is not a typical PIP2-specific PH domain. We have identified a 13-residue sequence of basic-hydrophobic-basic amino acids within the putative PH domain that may be a major determinant of binding of AMIC to acidic phospholipids. Despite the lack of stereospecificity, AMIC binds 10 times more strongly to vesicles containing 5% PIP2 plus 25% PS than to vesicles containing only 25% PS, suggesting that AMIC may be targeted to PIP2-enriched regions of the plasma membrane. In agreement with this, AMIC colocalizes with PIP2 at dynamic, protrusive regions of the plasma membrane. We discuss the possibility that AMIC binding to PIP2 may initiate the formation of a multiprotein complex at the plasma membrane.


Figures

FIGURE 1.
FIGURE 1.
Schematic representation of heavy chains of FL-AMIC and T4. The domain structures of the heavy chains, the subdomains of the tails, and the amino acid sequence of the putative PH domain are shown. Residues in red are generally conserved among PH domains, and underlined residues are predicted to form β-strands (10); Arg-779, which was mutated to Ala in one experiment (see Fig. 4), is indicated by the red arrow, and the sequence (residues 802-814) corresponding to synthetic peptide BHB-1 (see Fig. 5) is in boldface type.
FIGURE 2.
FIGURE 2.
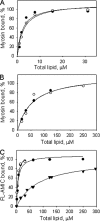
Phospholipid concentration dependence of binding of FL-AMIC and T4 to vesicles with different PS and PIP2 content. A and B, comparison of binding of FL-AMIC and T4 to 75% PS vesicles (A) and 5% PIP2 vesicles (B). Filled circles, FL-AMIC; open circles, T4. C, binding of FL-AMIC to 25% PS vesicles (▾), 50% PS vesicles (○), and 5% PIP2 plus 25% PS vesicles (•). The percentage of acidic phospholipid lipid was kept constant, and the concentration of total lipid was varied. Note that the scales of the x axes differ in different panels. Binding assays were performed as described under “Materials and Methods.” FL-AMIC and T4 concentrations were 50 nm. In this and all figures, a percentage sign represents mol %. Each experiment in this and subsequent figures is representative of at least two independent experiments.
FIGURE 3.
FIGURE 3.
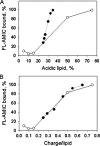
Binding of FL-AMIC to vesicles with varied PS content and to 25% PS vesicles with varied PIP2 content. A, dependence of binding on the percentage of acidic phospholipid in the vesicles. Open circles, PS content varied from 5 to 75%; filled circles, 25% PS vesicles additionally containing 1-10% PIP2. B, the same data plotted as a function of the average negative charge per phospholipid molecule, assuming a net negative charge of -4 for PIP2, -1 for PS, and 0 for PC. The total lipid concentration was constant at 50 μm, whereas the percentage of acidic phospholipids was varied. The FL-AMIC concentration was 50 nm.
FIGURE 4.
FIGURE 4.
Effect of R779A mutation on binding of FL-AMIC to phospholipid vesicles. The binding assay was performed as in Fig. 2 with the percentage of acidic phospholipid constant and the concentration of total lipid varied. T4 (filled symbols) and FL-AMIC R779A mutant (open symbols) were 100 nm. Circles and triangles correspond to data from two independent experiments.
FIGURE 5.
FIGURE 5.
Specific inhibition of binding of T4 to acidic phospholipid vesicles by synthetic peptide BHB-1. A-D, binding of T4 to phospholipid vesicles with different compositions was performed, at constant total phospholipid and T4 concentrations, in the presence or absence of varying concentrations of synthetic peptides: BHB-1 (filled circles), BHB-2 (open circles), BHB-3 (filled triangles), and BHB-4 (open triangles). Peptide sequences (with mutated residues in boldface type) are as follows: BHB-1, KKVKPFLYVLKRR; BHB-2, KKVKAAAAAKRR; BHB-3, KKVKPAAYVLKRR; BHB-4, KKVKPFLYAAKRR. A, 50% PS vesicles, 50 μm total lipid; B, 6% PIP2 vesicles, 200 μm total lipid; C, 5% PIP2 plus 25% PS vesicles, 50 μm total lipid; D, 50% PS vesicles, 50 μm total lipid. T4 concentration was 70 nm.
FIGURE 6.
FIGURE 6.
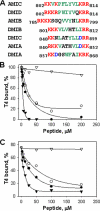
Comparison of the BHB region of AMIC with similar regions in other Acanthamoeba and Dictyostelium class-I myosins. A, comparison of sequences. The sequences are shown in the order of decreasing homology with AMIC sequence (according to pairwise alignment in GCG Lite (available on the World Wide Web) (data not shown). Basic residues are red, acidic residues are blue, and residues found inside the AMIC BHB region and similar residues in other sequences (i.e. Pro; large hydrophobic, Val, Ile, and Leu; and aromatic, Trp, Phe, and Tyr) are green. Note that only the last three myosins have acidic residues within the BHB region. The BHB regions of DMID and AMIB are most similar to AMIC (53 and 46% identity, respectively), and the BHB regions of AMIA and DMIA are least similar (35 and 26% identity, respectively). DMIE (not shown) does not have an obvious BHB region. Accession numbers are as follows: AMIA, AAC35357; AMIB, P19706; AMIC, AAC98089; DMIA, P22467; DMIB, P34092; DMIC, L35323; DMID, P34109; DMIE, L06805. B and C, comparison of the ability of synthetic peptides corresponding to the BHB regions of AMIC (filled circles), AMIB (open circles), DMID (filled triangles), and AMIA (open triangles) to inhibit binding of T4 to 50% PS vesicles (B) and 6% PIP2 vesicles (C). The sequences of synthetic peptides were as shown in A. T4 concentration was 100 μm; total lipid concentration was 50 μm for 50% PS vesicles and 250 μm for 6% PIP2 vesicles. The results compared within each panel were obtained in parallel with the same batch of vesicles and T4. The binding assays were performed as in Fig. 4.
FIGURE 7.
FIGURE 7.
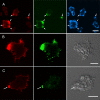
Colocalization of endogenous AMIC and PIP2 in large and small pseudopods. Amoebae were stained for AMIC (red), PIP2 (green), and F-actin (blue), as described under “Materials and Methods.” The gray panels are differential interference contrast images. The arrows point to the regions where AMIC and PIP2 are colocalized. Bar, 20 μm (A) and 10 μm (B and C).
FIGURE 8.
FIGURE 8.
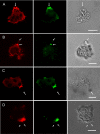
Colocalization of endogenous AMIC and PIP2 in endocytic cups (A, B, C) and at the base of filopodia (D). Amoebae were stained for AMIC (red) and PIP2 (green). Gray panels are differential interference contrast images. Bar, 10 μm.
FIGURE 9.
FIGURE 9.
Staining of cells with membrane dyes and AMIC and PIP2 antibodies. Amoebae were stained for AMIC (A and D) and PIP2 (C and F), and with membrane markers DiI (B) or concanavalin A (E). Bars, 10 μm.

References

    1. Pollard, T. D., Doberstein, S. K., and Zot, H. G. (1991) Annu. Rev. Physiol. 53 653-681 - PubMed
    1. Berg, J. S., Powell, B. C., and Cheney, R. E. (2001) Mol. Biol. Cell 12 780-794 - PMC - PubMed
    1. Sellers, J. R. (2000) Biochim. Biophys. Acta 1496 3-22 - PubMed
    1. Brzeska, H., Lynch, T. J., and Korn, E. D. (1988) J. Biol. Chem. 263 427-435 - PubMed
    1. Lynch, T. J., Albanesi, J. P., Korn, E. D., Robinson, E. A., Bowers, B., and Fujisaki, H. (1986) J. Biol. Chem. 261 17156-17162 - PubMed

Publication types

LinkOut - more resources