Calcium-permeable presynaptic AMPA receptors in cerebellar molecular layer interneurones
- PMID: 18772200
- PMCID: PMC2652151
- DOI: 10.1113/jphysiol.2008.159921
Calcium-permeable presynaptic AMPA receptors in cerebellar molecular layer interneurones
Abstract
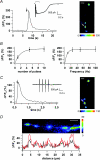
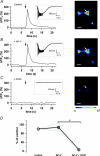
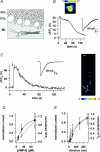
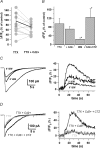
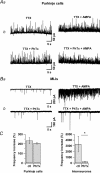
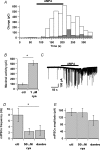
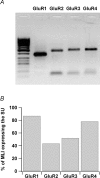
Axons of cerebellar molecular layer interneurones (MLIs) bear ionotropic glutamate receptors. Here, we show that these receptors elicit cytosolic [Ca2+] transients in axonal varicosities following glutamate spillover induced by stimulation of parallel fibres (PFs). A spatial profile analysis indicates that these transients occur at the same locations when induced by PF stimulation or trains of action potentials. They are not affected by the NMDAR antagonist AP-V, but are abolished by the AMPAR inhibitor GYKI-53655. Mimicking glutamate spillover by a puff of AMPA triggers axonal [Ca2+]i transients even in the presence of TTX. Addition of specific voltage-dependent Ca2+ channel (VDCC) blockers such as omega-AGAIVA and omega-conotoxin GVIA or broad range inhibitors such as Cd2+ did not significantly inhibit the signal indicating the involvement of Ca2+-permeable AMPARs. This hypothesis is further supported by the finding that the subunit specific AMPAR antagonist IEM-1460 blocks 75% of the signal. Bath application of AMPA increases the frequency and mean peak amplitude of GABAergic mIPSCs, an effect that is blocked by philanthotoxin-433 (PhTx) and reinforced by facilitating concentrations of ryanodine. By contrast, a high concentration of ryanodine or dantrolene reduced the effects of AMPA on mIPSCs. Single-cell RT-PCR experiments show that all GluR1-4 subunits are potentially expressed in MLI. Taken together, the results suggest that Ca2+-permeable AMPARs are colocalized with VDCCs in axonal varicosities and can be activated by glutamate spillover through PF stimulation. The AMPAR-mediated Ca2+ signal is amplified by Ca2+-induced Ca2+ release from intracellular stores, leading to GABA release by MLIs.
Figures

Similar articles
-
Action potential-evoked Ca2+ signals and calcium channels in axons of developing rat cerebellar interneurones.J Physiol. 2000 Aug 15;527 Pt 1(Pt 1):33-48. doi: 10.1111/j.1469-7793.2000.00033.x. J Physiol. 2000. PMID: 10944168 Free PMC article.
-
Characterization of AMPA receptors targeted by the climbing fiber transmitter mediating presynaptic inhibition of GABAergic transmission at cerebellar interneuron-Purkinje cell synapses.J Neurosci. 2006 Feb 22;26(8):2278-89. doi: 10.1523/JNEUROSCI.4894-05.2006. J Neurosci. 2006. PMID: 16495455 Free PMC article.
-
AMPA receptor activation controls type I metabotropic glutamate receptor signalling via a tyrosine kinase at parallel fibre-Purkinje cell synapses.J Physiol. 2010 Aug 15;588(Pt 16):3063-74. doi: 10.1113/jphysiol.2010.191080. Epub 2010 Jul 5. J Physiol. 2010. PMID: 20603338 Free PMC article.
-
Presynaptic NMDA receptors act as local high-gain glutamate detector in developing cerebellar molecular layer interneurons.J Neurochem. 2013 Jul;126(1):47-57. doi: 10.1111/jnc.12279. Epub 2013 May 15. J Neurochem. 2013. PMID: 23607752
-
Ca(2+) permeable AMPA receptors switch allegiances: mechanisms and consequences.J Physiol. 2012 Jan 1;590(1):13-20. doi: 10.1113/jphysiol.2011.213926. Epub 2011 Sep 5. J Physiol. 2012. PMID: 21893602 Free PMC article. Review.
Cited by
-
Independent control of reciprocal and lateral inhibition at the axon terminal of retinal bipolar cells.J Physiol. 2013 Aug 15;591(16):3833-51. doi: 10.1113/jphysiol.2013.253179. Epub 2013 May 20. J Physiol. 2013. PMID: 23690563 Free PMC article.
-
Transmembrane AMPA receptor regulatory proteins and AMPA receptor function in the cerebellum.Neuroscience. 2009 Sep 1;162(3):656-65. doi: 10.1016/j.neuroscience.2009.01.004. Epub 2009 Jan 13. Neuroscience. 2009. PMID: 19185052 Free PMC article. Review.
-
Astrocyte-Neuron Signaling in Synaptogenesis.Front Cell Dev Biol. 2021 Jul 2;9:680301. doi: 10.3389/fcell.2021.680301. eCollection 2021. Front Cell Dev Biol. 2021. PMID: 34277621 Free PMC article. Review.
-
Calcium-permeable AMPA receptors in neonatal hypoxic-ischemic encephalopathy (Review).Biomed Rep. 2013 Nov;1(6):828-832. doi: 10.3892/br.2013.154. Epub 2013 Jul 30. Biomed Rep. 2013. PMID: 24649036 Free PMC article.
-
Synergism of type 1 metabotropic and ionotropic glutamate receptors in cerebellar molecular layer interneurons in vivo.Elife. 2020 May 13;9:e56839. doi: 10.7554/eLife.56839. Elife. 2020. PMID: 32401196 Free PMC article.
References
-
- Auger C, Marty A. Heterogeneity of functional synaptic parameters among single release sites. Neuron. 1997;19:139–150. - PubMed
-
- Barbour B, Keller BU, Llano I, Marty A. Prolonged presence of glutamate during excitatory synaptic transmission to cerebellar Purkinje cells. Neuron. 1994;12:1331–1343. - PubMed
Publication types
MeSH terms
Substances
LinkOut - more resources
Full Text Sources
Miscellaneous

