. 2008 Nov 1;586(21):5259-76.
doi: 10.1113/jphysiol.2008.158105. Epub 2008 Sep 4.

Differential origin of reticulospinal drive to motoneurons innervating trunk and hindlimb muscles in the mouse revealed by optical recording

Affiliations

Differential origin of reticulospinal drive to motoneurons innervating trunk and hindlimb muscles in the mouse revealed by optical recording

Karolina Szokol et al. J Physiol. .

Abstract

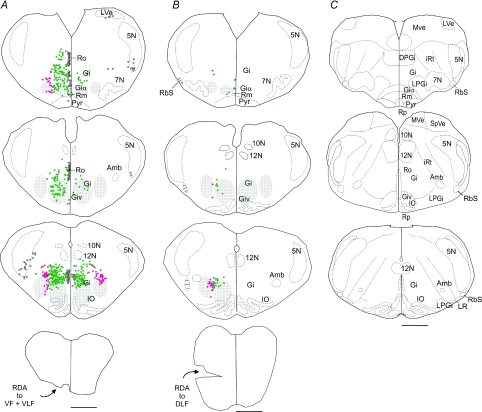
To better understand how the brainstem reticular formation controls and coordinates trunk and hindlimb muscle activity, we used optical recording to characterize the functional connections between medullary reticulospinal neurons and lumbar motoneurons of the L2 segment in the neonatal mouse. In an isolated brainstem-spinal cord preparation, synaptically induced calcium transients were visualized in individual MNs of the ipsilateral and contralateral medial and lateral motor columns (MMC, LMC) following focal electrical stimulation of the medullary reticular formation (MRF). Stimulation of the MRF elicited differential responses in MMC and LMC, according to a specific spatial organization. Stimulation of the medial MRF elicited responses predominantly in the LMC whereas stimulation of the lateral MRF elicited responses predominantly in the MMC. This reciprocal response pattern was observed on both the ipsilateral and contralateral sides of the spinal cord. To ascertain whether the regions stimulated contained reticulospinal neurons, we retrogradely labelled MRF neurons with axons coursing in different spinal funiculi, and compared the distributions of the labelled neurons to the stimulation sites. We found a large number of retrogradely labelled neurons within regions of the gigantocellularis reticular nucleus (including its pars ventralis and alpha) where most stimulation sites were located. The existence of a mediolateral organization within the MRF, whereby distinct populations of reticulospinal neurons predominantly influence medial or lateral motoneurons, provides an anatomical substrate for the differential control of trunk and hindlimb muscles. Such an organization introduces flexibility in the initiation and coordination of activity in the two sets of muscles that would satisfy many of the functional requirements that arise during postural and non-postural motor control in mammals.


Figures

Figure 1
Figure 1. Isolated brainstem–spinal cord preparation
A, low magnification micrograph of a brainstem–spinal cord preparation isolated from a P4 mouse (side view, ventral side up) showing the position and orientation of the stimulating electrode. Left inset: MNs in the MMC and LMC of the L2 segment labelled retrogradely with CGDA and viewed from the ventral surface of the cord. Right inset: Parasagittal section of the brainstem (ventral side up) showing the trajectory of a DiI-coated electrode. B and C, effective stimulation parameters for evoking Ca2+ responses in iLMC and iMMC. The graphs on the left display the amplitude–frequency curves when stimulating at 2 times threshold (T) with a 5 s train (filled circles) and the response amplitudes as a function of the train duration when stimulating at 2T and 10 Hz (individual open circles). Each response in the amplitude–frequency curves is an average (6–30 MNs) expressed as a percentage of the response at 10 Hz. The graphs on the right display the amplitudes induced by 5 s, 10 Hz stimulation as a function of the current at threshold. All values are means ± standard error of the mean.
Figure 7
Figure 7. Effects of spinal cord lesions on responses evoked by medial MRF stimulation
A, box-and-whisker plots (left) showing the responses that remain after lesion, expressed as a percentage of the control responses. The specific lesions are shown in the corresponding connectivity diagrams (right) where connections rendered ineffective by the lesions are shown as light-grey elements. The organization of the connectivity diagrams relies on 5 assumptions explained in the text. The upper diagram shows connections needed to explain the residual responses following an ipsilateral lesion, the middle diagram adds connections needed to explain the residual responses following a contralateral lesion, and the lower diagram adds connections needed to explain the residual responses following a contralateral lesion. B, diagram of putative crossed and uncrossed pathways between medullary RS neurons and L2 motor columns and commissural interneurons. The grey rectangles (omitted in A for the sake of clarity) indicate that RS neurons may act through mono- and/or polysynaptic pathways. For each of the motor columns, the principal connections deduced from these experiments are shown as thicker lines.
Figure 2
Figure 2. Stimulation of the medial MRF evokes larger Ca2+ responses in iLMC
A, pseudocolour representations of the first 28 s of two 120 s recording sessions (frame exposure of 250 ms) showing the Ca2+ fluorescence in the iMMC (top row) and iLMC (bottom row) before, during and after the first of two trains of stimuli (5 s duration, 200 μs pulse at 10 Hz, 60 μA = 2.4T) delivered to the medial MRF in a P1 mouse. The locations of the manually defined ROIs over six individual motoneurons in the iMMC and iLMC are shown in the first and last frames (open circles). B, waveforms of the changes in fluorescence in iMMC (green) and iLMC (red) for the entire recording session. Each waveform is an average of the waveforms from the six ROIs. The time windows during which stimulation occurred are indicated by the grey shading. The arrows indicate the presence of spontaneous bursts of activity. Such spontaneous activity was routinely observed in neonatal preparations and was often largest in the LMC. Evoked responses that were obviously contaminated by spontaneous activity were not analysed in this study (see Methods). As shown in supplementary video 3A, the same difference in response amplitude (larger in iLMC than in iMMC) was seen when MNs in the iLMC and iMMC were recorded simultaneously instead of sequentially as illustrated here. C, plot of the normalized responses in the iMMC (green) and iLMC (red). Each point represents the average responses from the two trains for each MN/ROI, normalized to the mean response in iLMC. The mean response in iMMC and iLMC are shown as horizontal bars.
Figure 3
Figure 3. Stimulation of the lateral MRF evokes larger Ca2+ responses in iMMC
A, pseudocolour representations of the first 28 s of two recording sessions showing the Ca2+ fluorescence before, during and after the first of two trains of stimuli (40 μA = 2T) delivered to the lateral MRF in a P1 mouse. B, waveforms of the changes in fluorescence in iMMC (green) and iLMC (red) for the entire recording session. The same difference in response amplitude (larger in iMMC than in iLMC) was seen when MNs in the iLMC and iMMC were recorded simultaneously (supplementary video 3B) instead of sequentially as shown here. C, plot of the normalized responses in the iMMC (green) and iLMC (red). For other details see Fig. 2.
Figure 4
Figure 4. Medial and lateral MRF stimulations elicit reciprocal responses in the MMC and LMC both ipsi- and contralaterally
A, cumulative distribution of the normalized Ca2+ responses evoked ipsilaterally (iMMC/iLMC) by stimulation of the medial and lateral MRF. Each point shows the mean response in a single preparation (responses of 6 mN to two trains) with standard deviation indicated by the bar. The grand mean was 0.36 ± 0.25 for the medial MRF distribution and 2.67 ± 1.79 for the lateral MRF distribution. B, cumulative distribution of the normalized Ca2+ responses evoked contralaterally (coMMC/coLMC). The grand mean was 0.48 ± 0.25 for the medial MRF distribution and 3.22 ± 1.58 for the lateral MRF distribution. Crosses: experiments which were performed in other wild-type or transgenic mice (see Methods).
Figure 5
Figure 5. MRF stimulation sites giving rise to responses in trunk versus limb MNs are segregated along the mediolateral axis
A, stimulation sites recovered from transverse brainstem sections (32 sites) and plotted directly on standardized sections (from a P2 mouse) at three different anteroposterior levels (250 μm apart). In all of these experiments the locations of the stimulation sites were confirmed histologically from electrolytic lesions. Note that the overlap of stimulation sites with the inferior olive is a visual artifact due to the fact that the standardized section differs from the sections recovered from recorded preparations. In fact, only two stimulation sites were located in the inferior olive, the others were dorsal to the inferior olive. Filled squares and open circles indicate effective sites that evoked predominant Ca2+ responses in LMC and MMC, respectively. The open triangle on the most caudal section indicates an ineffective site. B, stimulation sites recovered from parasagittal sections of the brainstem (15 effective, 4 ineffective sites), plotted on a single standardized transverse section. As for the dataset shown in A, the locations of the stimulation sites were confirmed histologically from electrolytic lesions. Note that this is a projection such that the sites are not at their actual anteroposterior positions. C, plot of 26 additional effective stimulation sites for which electrolytic lesions were ambiguous but mediolateral positions could be obtained from photographs of the electrode entry point (see Methods). The scale is the same for A–C. All three datasets show the same segregation into two clusters along the mediolateral axis. D, amplitude of Ca2+ responses (5 s train, at 2T) plotted as function of the depth of the electrode along a trajectory in the medial MRF, expressed as a percentage of the maximal response in iLMC. Because the electrode track is at a 30 deg angle to the longitudinal axis, to relate these depths to the transverse sections in A or B the bottom scale must be used. In doing so, the 0 mm value must be positioned at the ventral surface of the brainstem. 7N: facial nucleus; 10N: dorsal motor nucleus of the vagus; 12N: hypoglossal nucleus; Amb: ambiguus nucleus; cc: central canal; Gi: gigantocellularis reticular nucleus (Giα: pars alpha); IO: inferior olive nucleus; Pyr: pyramidal tract.
Figure 6
Figure 6. Retrograde labelling of brainstem neurons with descending axons
A and B, line drawings of transverse sections made from low magnification photomicrographs of representative transverse sections through the medulla showing the distribution of neurons that were retrogradely labelled by application of RDA to VF + VLF or to DLF at the level of C1–C3 in P1 mice. Only the labelled neurons in the region of the medulla where we applied electrical stimulation are shown. In each experiment, the RDA application site (lesion) is visible in the caudal-most drawing. Note, however, that the application site was actually more extensive longitudinally. For the sake of clarity, each dot represents 1–5 retrogradely labelled neurons. After plotting of the labelled neurons, the sections were counterstained with methylene blue. The most discernible internal structures (Amb, 7N, 10N, 12N and IO) were traced directly from the stained sections. The borders of the structures that were less conspicuous (LV, 5 N and LR) are only rough estimates. Cross-hatched areas have been positioned on each side of the midline to indicate the regions containing the effective stimulation sites in the medial and lateral MRF. Labelled neurons are shown as green or red dots according to whether they are in register with the medial or lateral cross-hatched areas, respectively. The RS neurons located outside these areas including in the boundary region between the two areas were not assigned any colour. C, to help orientation, additional structures are delineated in standard P0 mouse sections, adapted and modified from Paxinos et al. (2007). 5N: spinal trigeminal nucleus; DPGi: dorsal paragigantocellularis nucleus; Giv: gigantocellularis pars ventralis; LPGi: lateral paragigantocellularis nucleus; LVe: lateral vestibular nucleus; LR: lateral reticular nucleus; iRt: intermediate reticuløar nucleus; MVe: medial vestibular nucleus; RbS: rubrospinal tract; Rm: raphe nucleus magnus; Ro: raphe nucleus obscurus; Rp: raphe nucleus pallidus; SpVe: spinal vestibular nucleus. For other abbreviations see Fig. 5. Scale bars are 500 μm.

Similar articles

Cited by

References

    1. Alstermark B, Ogawa J. In vivo recordings of bulbospinal excitation in adult mouse forelimb motoneurons. J Neurophysiol. 2004;92:1958–1962. - PubMed
    1. Altman J, Bayer SA. Development of the brain stem in the rat. J Comp Neurol. 1980a;194:1–35. I. Thymidine-radiographic study of the time of origin of neurons of the lower medulla. - PubMed
    1. Altman J, Bayer SA. Development of the brain stem in the rat. J Comp Neurol. 1980b;194:37–56. II. Thymidine-radiographic study of the time of origin of neurons of the upper medulla, excluding the vestibular and auditory nuclei. - PubMed
    1. Auclair F, Bélanger MC, Marchand R. Ontogenetic study of early brain stem projections to the spinal cord in the rat. Brain Res Bull. 1993;30:281–389. - PubMed
    1. Auclair F, Marchand R, Glover JC. Regional patterning of reticulospinal and vestibulospinal neurons in the hindbrain of mouse and rat embryos. J Comp Neurol. 1999;411:288–300. - PubMed

Publication types