. 2008 Oct;173(4):1186-201.
doi: 10.2353/ajpath.2008.071183. Epub 2008 Sep 4.

Hypoxia inducible factor-1alpha inactivation unveils a link between tumor cell metabolism and hypoxia-induced cell death

Affiliations

Hypoxia inducible factor-1alpha inactivation unveils a link between tumor cell metabolism and hypoxia-induced cell death

Elena Favaro et al. Am J Pathol. 2008 Oct.

Abstract

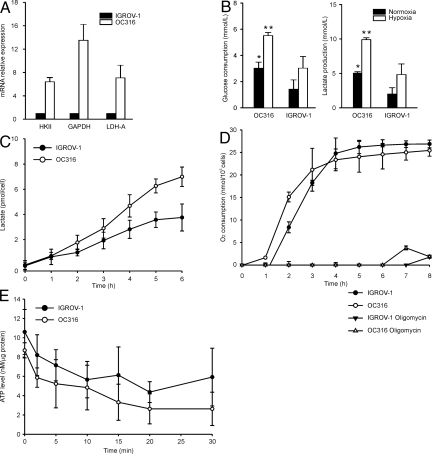
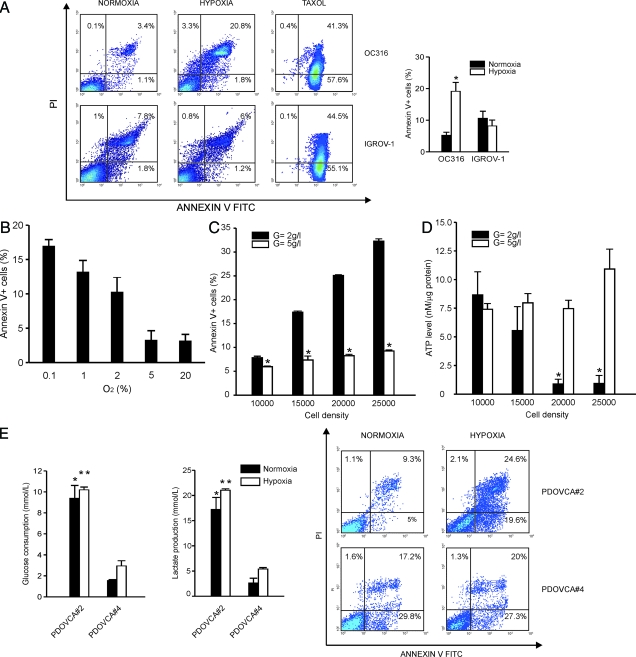
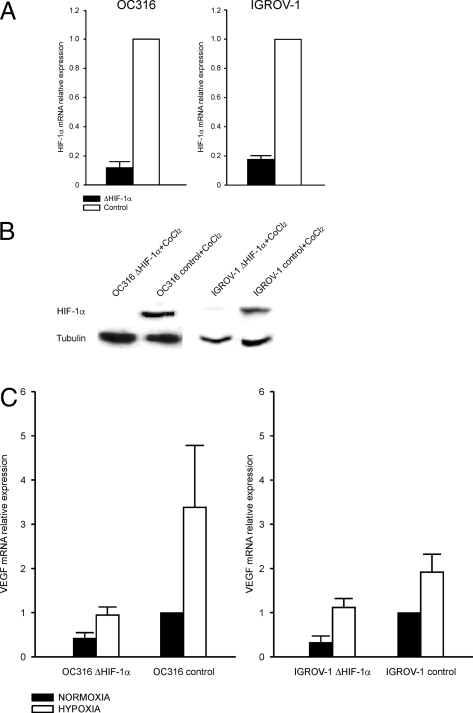
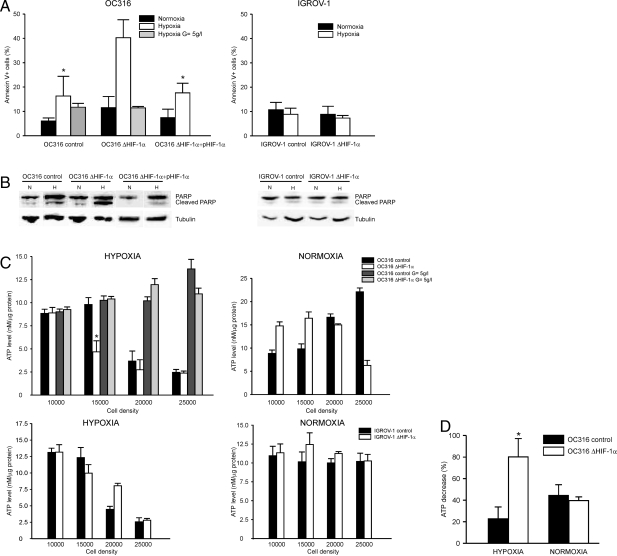
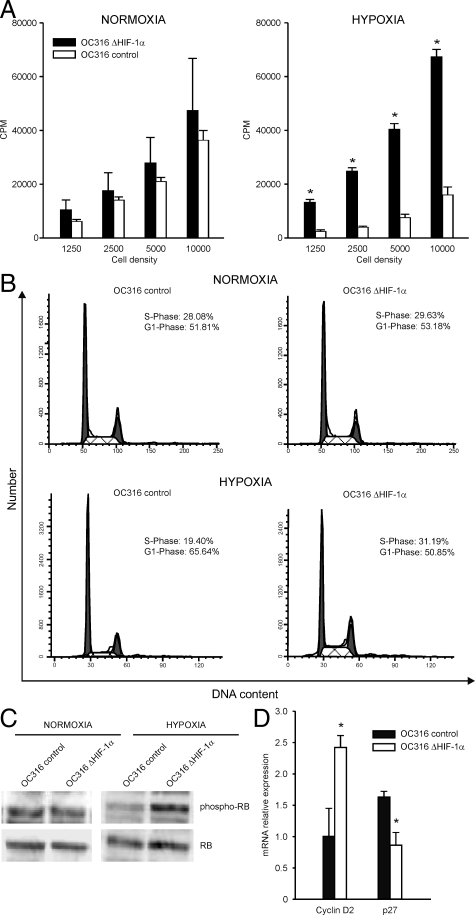
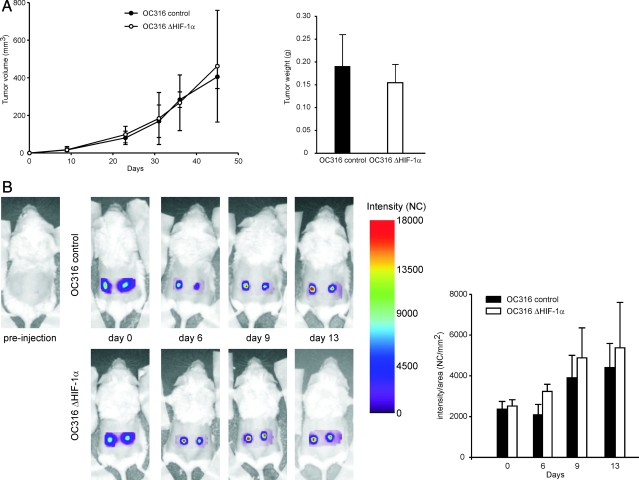
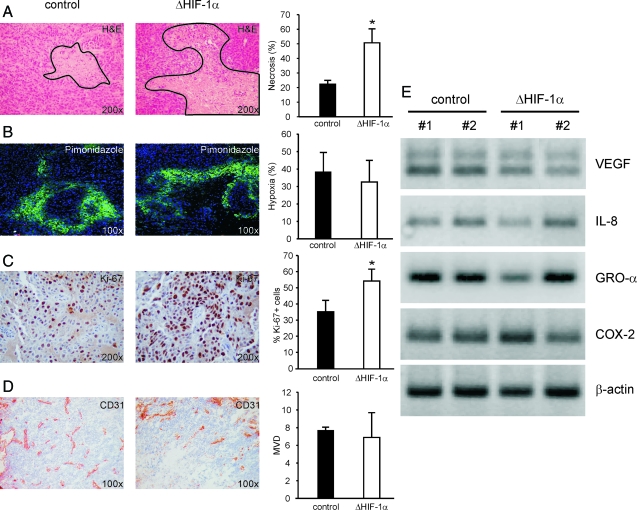
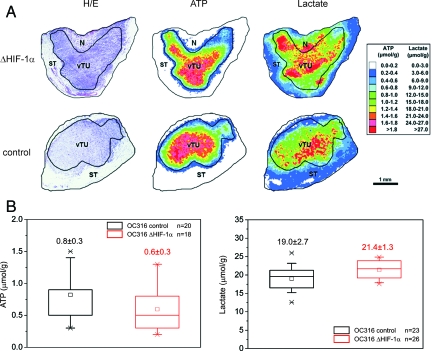
Hypoxia and the acquisition of a glycolytic phenotype are intrinsic features of the tumor microenvironment. The hypoxia inducible factor-1alpha (HIF-1alpha) pathway is activated under hypoxic conditions and orchestrates a complex transcriptional program that enhances cell survival. Although the consequences of HIF-1alpha inactivation in cancer cells have been widely investigated, only a few studies have addressed the role of HIF-1alpha in the survival of cancer cells endowed with different glycolytic capacities. In this study, we investigated this aspect in ovarian cancer cells. Hypoxia-induced toxicity was increased in highly glycolytic cells compared with poorly glycolytic cells; it was also associated with a sharp decrease in intracellular ATP levels and was prevented by glucose supplementation. Stable HIF-1alpha silencing enhanced hypoxia-induced cell death in vitro due to a lack of cell cycle arrest. Tumors bearing attenuated HIF-1alpha levels had similar growth rates and vascularization as did controls, but tumors showed higher proliferation levels and increased necrosis. Moreover, tumors formed by HIF-1alpha deficient cells had higher levels of lactate and lower ATP concentrations than controls as shown by metabolic imaging. The findings that such metabolic properties can affect the survival of cancer cells under hypoxic conditions and that these properties contribute to the determination of the consequences of HIF-1alpha inactivation could have important implications on the understanding of the effects of anti-angiogenic and HIF-1alpha-targeting drugs in cancer.


Figures

Figure 1
Figure 1
Identification of ovarian cancer cells with different metabolic properties. A: Expression of genes involved in glycolysis (HKII, GAPDH, and LDH-A) by quantitative PCR analysis in ovarian cancer cells. Expression of each gene was normalized to the β2-microglobulin transcript, used as housekeeping gene. The expression levels in IGROV-1 cells were then set at 1 and relative expression levels were calculated. Mean ± SD of three experiments is shown. B: Measurement of glucose consumption (left panel) and lactate production (right panel). Cells were plated in P6 wells at 1.5 × 10⁵ cells/well, incubated for 24 hours in vitro under either normoxic or hypoxic conditions and metabolic parameters quantified by an automatic analyzer. Mean ± SD of four experiments is shown, with statistically significant differences between OC316 and IGROV-1 cells under normoxic (*) or hypoxic (**) conditions (P < 0.05). C: Kinetics of lactate production. Each sample was analyzed in triplicate and mean ± SD of three independent experiments is shown. After 6 hours, OC316 and IGROV-1 cells showed a lactate production of 7.02 pmol/cell and 3.85 pmol/cell, respectively (mean values). D: Measurement of oxygen consumption by OC316 and IGROV-1 cells. Values reported in the y axis represent the nmoles of O2 consumed per 100,000 cells calculated as described in the Materials and Methods. Cells were cultured at 0.3 × 10⁶ cells/well in OBS wells (Becton Dickinson) in D5030 medium, with or without oligomycin (0.2 μg/ml), as detailed in the Materials and Methods. Each sample was analyzed in triplicate and mean values ± SD of four independent experiments are shown. E: Measurement of the rates of ATP decay following substrate deprivation in OC316 and IGROV-1 cells. The ATP content was determined and normalized to the protein content of the lysates. Mean ± SD of three independent experiments is shown.
Figure 2
Figure 2
Correlation between hypoxia-induced cell death and the glycolytic phenotype in ovarian cancer cells. A: Hypoxia-induced cell death in ovarian cancer cells. Cells were plated in P6 wells at 1.5 × 10⁵ cells/well. Following 72 hours incubation under normoxic or hypoxic conditions, the cells were labeled with Annexin V/PI and the level of cell death was measured by flow cytometry. The left panels show representative diagrams of hypoxia-sensitive (OC316) and hypoxia-resistant (IGROV-1) cells. To illustrate the differences in cell death features, a diagram showing apoptosis in ovarian cancer cells treated with taxol is also shown. In the right panels, mean ± SD values of n = 6 (OC316) or n = 7 (IGROV-1) different experiments is reported. *Statistically significant differences in the percentage of Annexin V+ OC316 cells under hypoxic versus normoxic conditions (P < 0.05). B: Levels of hypoxia-induced cell death in OC316 cells under various oxygen concentrations. OC316 cells were plated and incubated as detailed above by varying the levels of O2 in the hypoxic chamber. Annexin V binding was measured by flow cytometric analysis. Mean ± SD values of two experiments are shown. C: Glucose supplementation protects cancer cells from death under hypoxic conditions. OC316 cells were grown for 48 hours under hypoxic conditions with standard (2 g/L, low) or increased (5 g/L, high) glucose concentrations in the medium. Cell death was measured by measuring Annexin V/PI staining. Mean ± SD of five different experiments is shown. *Statistically significant differences in the percentage of Annexin V+ OC316 cells cultured in low- versus high-glucose medium (P < 0.05). D: Hypoxia-induced cell death depends on exhaustion of ATP levels and it is cell density–dependent. Cells were grown for 48 hours followed by measurement of intracellular ATP levels. The number of cells seeded in individual wells is reported on the x axis. ATP measurements were done in triplicate. Mean ± SD of five experiments is shown. *Statistically significant differences in the ATP levels in OC316 cells cultured in low- versus high-glucose medium (P < 0.05). E: Cellular responses of primary ovarian cancer cell cultures to hypoxia. Left panel, measurement of glucose consumption and lactic acid production by two primary epithelial ovarian cancer cultures from xenografts. Supernatants were collected after 24 hours in vitro culture under either normoxic or hypoxic conditions and metabolic parameters quantified by an automatic analyzer. Values were normalized to cell counts at time of collection of the supernatants. Mean ± SD of three experiments is shown. Statistically significant differences between PDOVCA#2 and PDOVCA#4 cells under normoxic (*) or hypoxic (**) conditions (P < 0.05). Right panel, detection of hypoxia-induced cell death in primary epithelial ovarian cancer cells. Following 72 hours incubation in the presence of 0.3% O2, the cells were labeled with Annexin V/PI and the level of cell death was measured by flow cytometry. The panels show representative diagrams of both hypoxia-sensitive (PDOVCA#2) and hypoxia-resistant (PDOVCA#4) cells.
Figure 3
Figure 3
Stable silencing of HIF-1α by lentiviral vector-mediated transfer of shRNA in ovarian cancer cells. A: Reduction of HIF-1α transcripts levels in IGROV-1 ΔHIF-1α and OC316 ΔHIF-1α cells by quantitative RT-PCR analysis. Mean ± SD of three different transduction experiments is shown. B: Detection of HIF-1α protein by Western blot analysis in lysates of OC316 and IGROV-1 transduced cells incubated in the presence of the hypoxia-mimetic drug CoCl2. Tubulin was used as a loading control. C: Measurement of expression of HIF-1-controlled gene VEGF in OC316 and IGROV-1 cell derivatives by quantitative PCR analysis. Mean ± SD of three different experiments performed is shown.
Figure 4
Figure 4
Hypoxia-induced cell death in cancer cells bearing attenuated HIF-1α expression is associated with anticipated depletion of intracellular ATP levels. A: Flow cytometric analysis of annexin V+ cells following 72 hours incubation in normoxic or hypoxic conditions. The plasmid pHIF-1α was used to transfect OC316 ΔHIF-1α cells and obtain HIF-1α-complemented cells as described in the Materials and Methods. Mean ± SD of three different experiments is shown. *Statistically significant differences in the percentage of Annexin V+ OC316 control or HIF-1α-complemented cells versus OC316 ΔHIF-1α cells under hypoxic conditions (P < 0.05). B: Western blot analysis of the amounts of cleaved PARP forms in cell lysates of samples treated as described in (A). Equivalent amounts of proteins were immunoblotted with anti-PARP and anti-tubulin as loading control. C: Effects of HIF-1α silencing on the energy status of epithelial ovarian cancer cells: measurement of intracellular ATP levels following 48 hours incubation under either normoxic or hypoxic conditions. OC316 (top panels) and IGROV-1 cells (botton panels) were plated at various densities in 96-well plates, with normal (2 g/L) or high (5 g/L) glucose concentrations. ATP measurements were done in triplicate. Mean ± SD of 1 representative experiment out of five performed is shown. *Statistically significant differences in ATP levels between OC316 ΔHIF-1α and control cells (P < 0.05). D: ATP consumption rates in OC316 ΔHIF-1α and control cells. Cells were incubated under normoxic or hypoxic conditions as reported in the Materials and Methods. The columns report the results of three independent experiments, as variation in the ATP levels (%) after 30 minutes incubation in D5030 medium. Mean ± SD of three experiments is shown. *Statistically significant differences in ATP consumption rates between OC316 ΔHIF-1α and control cells in hypoxic conditions (P < 0.05).
Figure 5
Figure 5
HIF-1α inactivation removes a brake to cell proliferation under hypoxic conditions in ovarian cancer cells. A: Proliferation of OC316 cells with different HIF-1α status by the [3H] thymidine assay after 48 hours incubation under normoxic or hypoxic conditions. Mean ± SD of three experiments is shown. *Statistically significant differences in the cpm values in OC316 control versus OC316 ΔHIF-1α cells under hypoxic conditions (P < 0.05). B: Cell cycle analysis of OC316 ΔHIF-1α or control cells following 48 hours incubation under normoxic or hypoxic conditions. One representative experiment is illustrated. C: Western blot analysis of the phosphorylated and non-phosphorylated Rb protein in lysates from OC316 cell derivatives under different experimental conditions. One representative experiment of two is shown. D: Expression of c-Myc target genes (Cyclin D2 and p27) under hypoxic conditions by quantitative PCR analysis. Expression of each gene was normalized to the β2-microglobulin transcript, used as house-keeping gene. The expression levels in OC316 control cells under normoxic conditions were then set at 1 and relative expression levels were calculated. Mean ± SD of three experiments is shown. *Statistically significant differences in OC316 control versus OC316 ΔHIF-1α cells under hypoxic conditions (P < 0.05).
Figure 6
Figure 6
Effects of HIF-1α inactivation on tumorigenicity of OC316 cells. A: Kinetics of tumor development in immunodeficient mice. SCID mice were injected s.c. with OC316 ΔHIF-1α or control OC316 cells (5 × 10⁴ cells/injection; 10 mice/group) and tumor growth curves were determined. The right panel shows the tumor weight at sacrifice. B: Optical imaging of EGFP expression. Left panel, longitudinal imaging of tumors. Representative fluorescence intensity images were acquired immediately after tumor cell injection (day 0) and 6, 9, and 13 days thereafter. Right panel, kinetics of EGFP intensity signal of OC316 control (n = 8 samples) and ΔHIF-1α (n = 6 samples) tumors.
Figure 7
Figure 7
Effects of HIF-1α inactivation on morphological parameters of tumors. A: Histological analysis of OC316 control and OC316 ΔHIF-1α tumors shows larger necrotic areas in tumors bearing reduced levels of HIF-1α expression. Representative images (original magnification: ×200) are shown. The continuous line marks the boards of necrotic tissue. The columns on the right indicate quantitative analysis of necrotic areas in five samples of each experimental group. *Statistically significant differences in percentage of necrotic areas in OC316 control versus OC316 ΔHIF-1α tumors (P < 0.05). B: Evaluation of hypoxia by pimonidazole adducts staining. Representative images (original magnification: ×100) are shown. The columns on the right indicate quantitative analysis of hypoxic areas (defined as those stained positive for pimonidazole) in five samples of each experimental group. C: Evaluation of proliferation in tumors by Ki-67 staining. Representative images (original magnification: ×200) are shown. The columns on the right indicate quantitative analysis of proliferation in six samples of each experimental group. *Statistically significant differences between OC316 control and OC316 ΔHIF-1α tumors (P < 0.05). D: Vascularization of OC316 ΔHIF-1α or control OC316 tumors by staining with anti-CD31 mAb and calculation of the microvessel density as described in the Materials and Methods. E: Expression of angiogenic factors including VEGF, interleukin-8, GRO-α and COX-2 in OC316 ΔHIF-1α or control OC316 tumors. Equivalent amounts of RNA obtained from two pools of three tumors of each type were used for cDNA synthesis and analyzed by RT-PCR. Bands were visualized on agarose gels following ethidium bromide staining.
Figure 8
Figure 8
Metabolic imaging of tumors. A: H&E staining as well as color-coded distributions of ATP and lactate in sequential cryosections from a representative OC316 ΔHIF-1α and an OC316 control tumor. The concentration values were color-coded, with each color corresponding to a defined concentration range in μmol/g. For structure-associated evaluation different histological areas were delineated, such as vital tumor tissue (vTU), stromal elements (ST), and necrosis (N). B: Metabolite concentrations (mean ± SD) in OC316 ΔHIF-1α and OC316 control tumors derived from vital tumor regions exclusively. ATP: n = 20 for cryosections from seven different tumors of OC316 control and n = 18 for OC316 ΔHIF-1α. Lactate: n = 23 for cryosections from eight different tumors of OC316 control and n = 26 for OC316 ΔHIF-1α.

References

    1. Harris AL. Hypoxia–a key regulatory factor in tumour growth. Nat Rev Cancer. 2002;2:38–47. - PubMed
    1. Fenton BM, Paoni SF, Ding I. Effect of VEGF receptor-2 antibody on vascular function and oxygenation in spontaneous and transplanted tumors. Radiother Oncol. 2004;72:221–230. - PubMed
    1. Franco M, Man S, Chen L, Emmenegger U, Shaked Y, Cheung AM, Brown AS, Hicklin DJ, Foster FS, Kerbel RS. Targeted anti-vascular endothelial growth factor receptor-2 therapy leads to short-term and long-term impairment of vascular function and increase in tumor hypoxia. Cancer Res. 2006;66:3639–3648. - PubMed
    1. Winkler F, Kozin SV, Tong RT, Chae SS, Booth MF, Garkavtsev I, Xu L, Hicklin DJ, Fukumura D, di Tomaso E, Munn LL, Jain RK. Kinetics of vascular normalization by VEGFR2 blockade governs brain tumor response to radiation: role of oxygenation, angiopoietin-1, and matrix metalloproteinases. Cancer Cell. 2004;6:553–563. - PubMed
    1. Ferrara N, Kerbel RS. Angiogenesis as a therapeutic target. Nature. 2005;438:967–974. - PubMed

Publication types

Substances