. 2008 Nov;295(5):G987-95.
doi: 10.1152/ajpgi.90272.2008. Epub 2008 Sep 4.

Severe NAFLD with hepatic necroinflammatory changes in mice fed trans fats and a high-fructose corn syrup equivalent

Affiliations

Severe NAFLD with hepatic necroinflammatory changes in mice fed trans fats and a high-fructose corn syrup equivalent

Laura H Tetri et al. Am J Physiol Gastrointest Liver Physiol. 2008 Nov.

Abstract

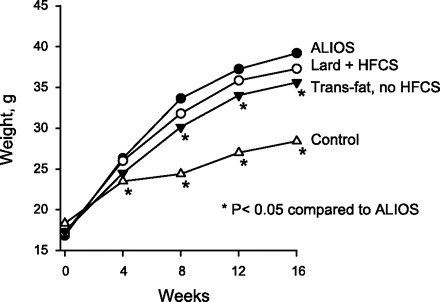
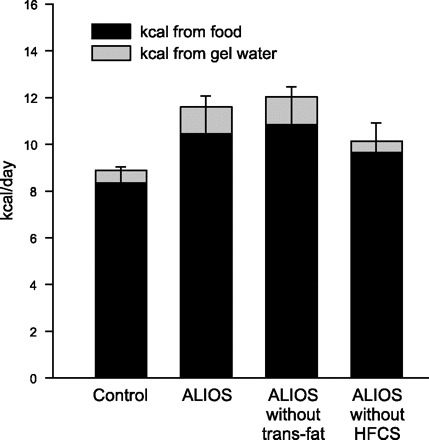
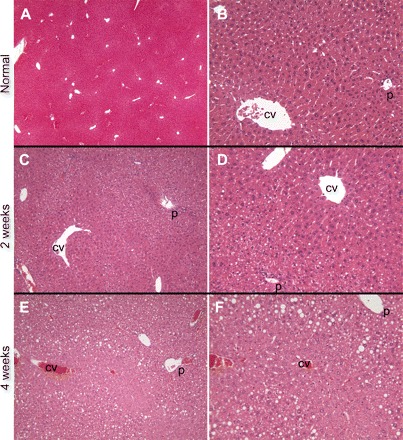
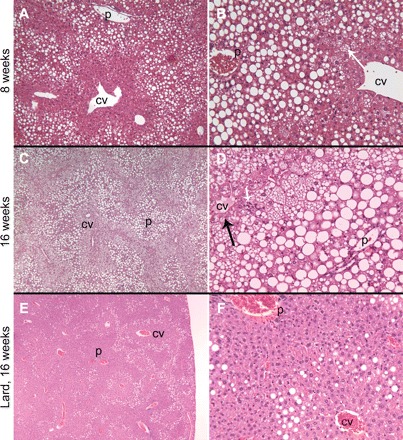
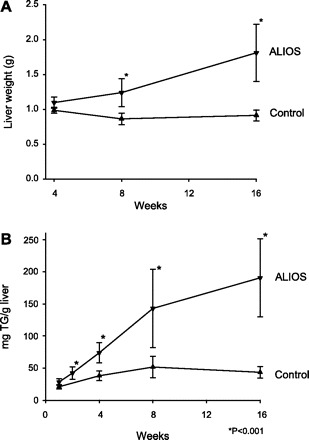
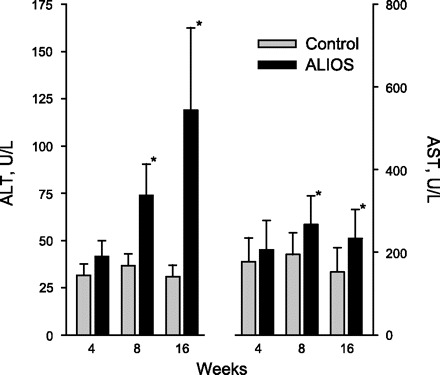
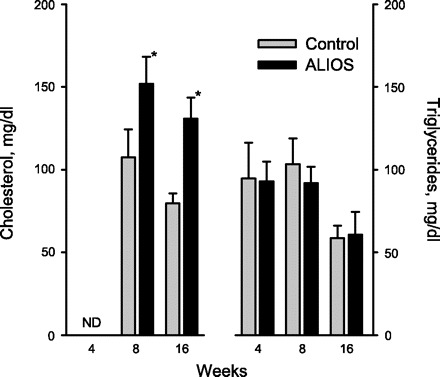
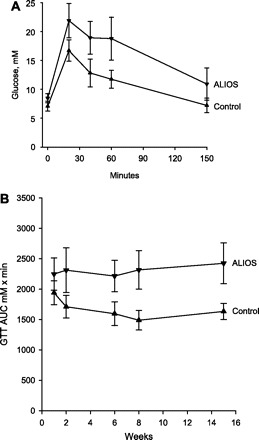
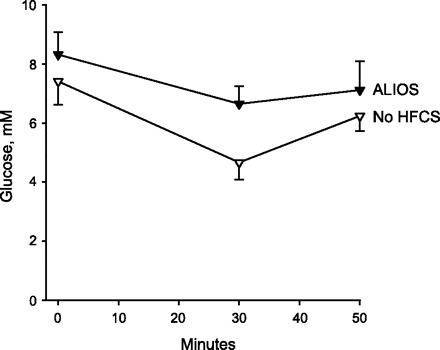
The aims of this study were to determine whether combining features of a western lifestyle in mice with trans fats in a high-fat diet, high-fructose corn syrup in the water, and interventions designed to promote sedentary behavior would cause the hepatic histopathological and metabolic abnormalities that characterize nonalcoholic steatohepatitis (NASH). Male C57BL/6 mice fed ad libitum high-fat chow containing trans fats (partially hydrogenated vegetable oil) and relevant amounts of a high-fructose corn syrup (HFCS) equivalent for 1-16 wk were compared with mice fed standard chow or mice with trans fats or HFCS omitted. Cage racks were removed from western diet mice to promote sedentary behavior. By 16 wk, trans fat-fed mice became obese and developed severe hepatic steatosis with associated necroinflammatory changes. Plasma alanine aminotransferase levels increased, as did liver TNF-alpha and procollagen mRNA, indicating an inflammatory and profibrogenic response to injury. Glucose intolerance and impaired fasting glucose developed within 2 and 4 wk, respectively. Plasma insulin, resistin, and leptin levels increased in a profile similar to that seen in patients with NASH. The individual components of this diet contributed to the phenotype independently; isocaloric replacement of trans fats with lard established that trans fats played a major role in promoting hepatic steatosis and injury, whereas inclusion of HFCS promoted food consumption, obesity, and impaired insulin sensitivity. Combining risk factors for the metabolic syndrome by feeding mice trans fats and HFCS induced histological features of NASH in the context of a metabolic profile similar to patients with this disease. Because dietary trans fats promoted liver steatosis and injury, their role in the epidemic of NASH needs further evaluation.


Figures

Fig. 1.
Fig. 1.
Mean weights of male C57BL/6 mice kept in cages without wire racks and fed high-trans fat chow and high-fructose corn syrup (HFCS) equivalent in amounts relevant to frequent consumers of fast food for 16 wk [American Lifestyle-Induced Obesity Syndrome (ALIOS) model]. ALIOS mice gained weight at a faster rate than control mice fed standard rodent chow and water and allowed unrestricted activity. The difference between the ALIOS and control groups was significant at all time points by the 1st week of treatment (P < 0.01). Mice kept under conditions identical to the ALIOS mice except for being fed chow containing lard instead of trans fats (Lard + HFCS) exhibited weight gain similar to the ALIOS mice. Mice kept under conditions identical to those of ALIOS mice except that they were not given HFCS weighed less than ALIOS mice by week 8.
Fig. 2.
Fig. 2.
Food and gel-water consumption expressed in terms of daily energy provided. The presence of HFCS in the gel-water was associated with an 8.2% increase in chow consumption compared with ALIOS mice not given HFCS (P < 0.05). Caloric intake was similar when trans fats were replaced by lard, indicating that fat substitution did not alter eating behavior. The number of calories provided by the gel-water is shown in the gray stacked bar and demonstrates the relative proportion of calories consumed compared with chow. The calories provided by gel-water not containing HFCS were derived from the collagen used to make the gel-water. Error bars denote SD for calories derived from chow. Significance of differences among groups is shown in Table 2.
Fig. 3.
Fig. 3.
Livers from control mice fed standard rodent chow demonstrated no evidence of steatosis at any time point (A and B, ×4 and ×20 images, respectively, from 16-wk mice). ALIOS mice at 1 wk had a few hepatocytes with areas of cytoplasmic clearing suggestive of steatosis that was accentuated in zone 1; on higher power some of these could be identified as fat droplets (not shown). At 2 wk, zone 1 small-droplet steatosis was more apparent, and there was continued sparing of zone 3 (C and D, ×10 and ×20, respectively). At 4 wk, larger fat droplets (macrovesicular steatosis) could be appreciated in zone 1 but zone 3 remained uninvolved (E and F, ×10 and ×20, respectively). Hematoxylin and eosin-stained sections. P, portal tract; CV, central vein.
Fig. 4.
Fig. 4.
At 8 wk, zone 1 hepatocytes were markedly expanded by macrovesicular steatosis. A distinct border between zone 1 and uninvolved zone 3 was created by hepatocytes with tiny-droplet (microvesicular, arrow) steatosis (A and B, ×10 and ×20, respectively). At 16 wk, zone 1 remained expanded with macrovesicular steatosis while the foamy, microvesicular steatosis expanded to involve all of zones 2 and 3 except a 1-cell layer rim of perivenular hepatocytes (C and D, ×4 and ×20, respectively, arrow). Scattered parenchymal foci of mixed inflammation were seen with increasing time of exposure to ALIOS conditions (arrowhead, D). Sedentary mice treated for 16 wk with lard and HFCS instead of trans fats and HFCS had substantially less steatosis. In the lard-fed mice, steatosis was macrovesicular and present in a distinctly midzonal (zone 2) pattern. None of the tiny-droplet (microvesicular) steatosis was present (E and F, ×4 and ×20, respectively). Hematoxylin and eosin-stained sections. P, portal tract; CV, central vein.
Fig. 5.
Fig. 5.
A: liver weight progressively increased in ALIOS mice from 11% above control at 4 wk to double the weight of control livers at 16 wk. B: liver triglyceride (TG) content progressively increased in ALIOS mice. Week 2 ALIOS liver TG content was greater than week 1 control liver TG content. TG content of ALIOS livers was >4-fold higher than control mice by week 16. Error bars denote SD, n = 8–10 mice/group.
Fig. 6.
Fig. 6.
Plasma alanine aminotransferase (ALT) was substantially elevated at 8 wk and further increased at 16 wk. Aspartate aminotransferase (AST) was also elevated above a relatively high baseline. Error bars denote SD; n = 8–10 mice/group. *P < 0.01.
Fig. 7.
Fig. 7.
Plasma cholesterol levels were significantly elevated at 8 and 16 wk, whereas triglyceride levels remained unchanged. The differences between the groups killed at 16 wk compared with earlier time points may be related to the different techniques used to kill animals at these time points (see materials and methods). Error bars denote SD; n = 8–10 mice/group; *P < 0.01. ND, not done.
Fig. 8.
Fig. 8.
A: glucose tolerance test (GTT) after 15 wk of ALIOS conditions. Mice received 1 mg/kg glucose by intraperitoneal injection at time 0. Blood glucose was greater in ALIOS mice compared with control mice at all time points, including fasting glucose levels (P < 0.01). B: GTTs were performed at multiple time points, and the areas under the curves (AUCs) are shown as a function of duration of treatment. Reduced glucose tolerance was noted within 2 wk of treatment, and impaired fasting glucose was evident by 6 wk. GTT AUC was greater in ALIOS mice compared with control mice at all time points measured (P < 0.01). Error bars denote SD; n = 10 mice/group.
Fig. 9.
Fig. 9.
Insulin tolerance in ALIOS mice compared with ALIOS mice with HFCS omitted from the water. Mice received 0.6 U/kg insulin by intraperitoneal injection, and blood glucose was measured at 0, 30, and 50 min. Omission of HFCS resulted in both improved fasting glucose levels (time 0) and improved response to insulin at 30 and 50 min (P < 0.01 at all time points).

References

    1. Albers MJ, Harnack LJ, Steffen LM, Jacobs DR. 2006 Marketplace survey of trans-fatty acid content of margarines and butters, cookies and snack cakes, and savory snacks. J Am Diet Assoc 108: 367–370, 2008 - PubMed
    1. Almind K, Kahn CR. Genetic determinants of energy expenditure and insulin resistance in diet-induced obesity in mice. Diabetes 53: 3274–3285, 2004 - PubMed
    1. Anstee QM, Goldin RD. Mouse models in non-alcoholic fatty liver disease and steatohepatitis research. Int J Exp Pathol 87: 1–16, 2006 - PMC - PubMed
    1. Bezerra RM, Ueno M, Silva MS, Tavares DQ, Carvalho CR, Saad MJ. A high fructose diet affects the early steps of insulin action in muscle and liver of rats. J Nutr 130: 1531–1535, 2000 - PubMed
    1. Buettner R, Ottinger I, Scholmerich J, Bollheimer LC. Preserved direct hepatic insulin action in rats with diet-induced hepatic steatosis. Am J Physiol Endocrinol Metab 286: E828–E833, 2004 - PubMed

Publication types

MeSH terms