. 2008;3(9):1422-34.
doi: 10.1038/nprot.2008.138.

Measurement of cardiac function using pressure-volume conductance catheter technique in mice and rats

Affiliations

Measurement of cardiac function using pressure-volume conductance catheter technique in mice and rats

Pál Pacher et al. Nat Protoc. 2008.

Abstract

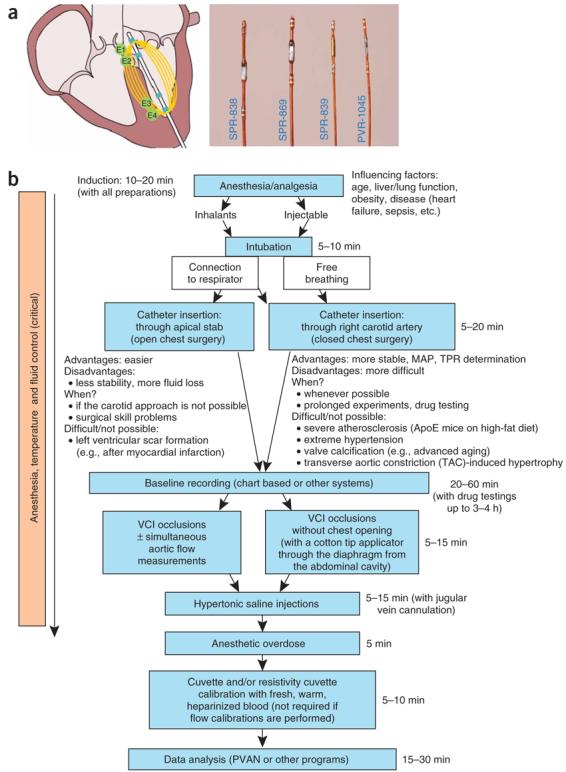
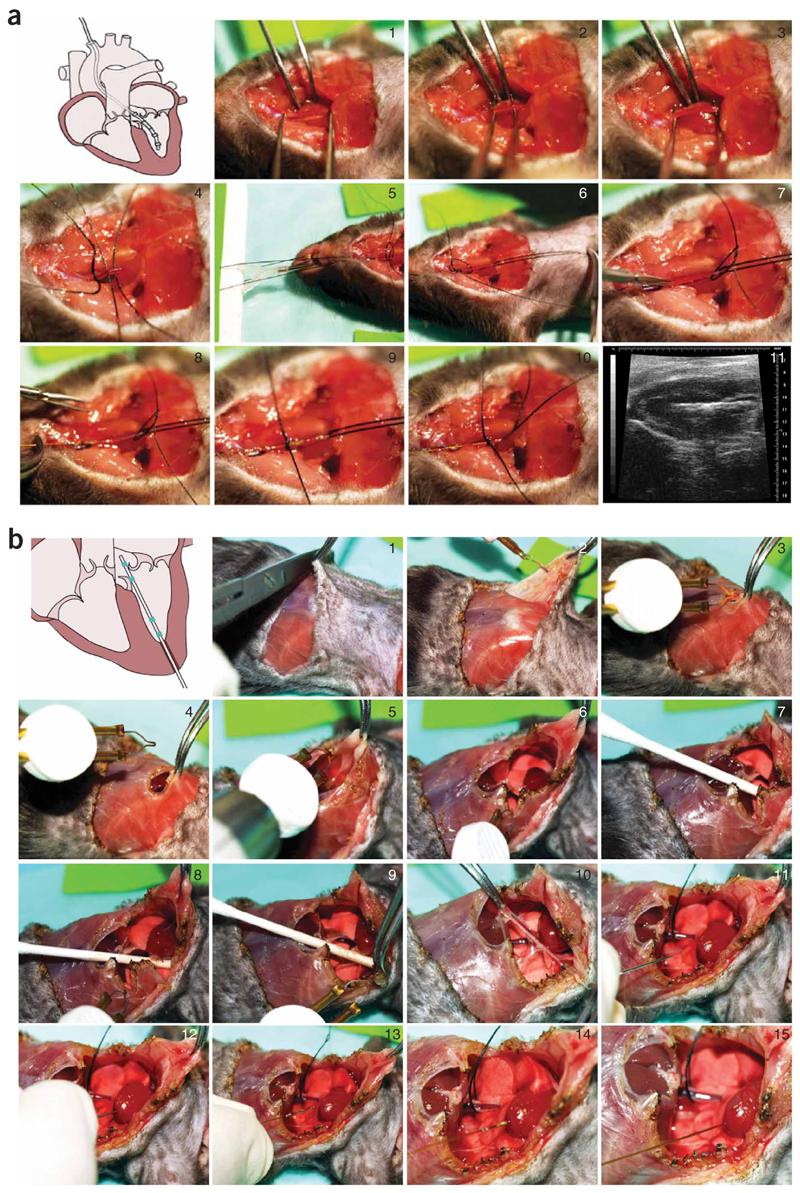
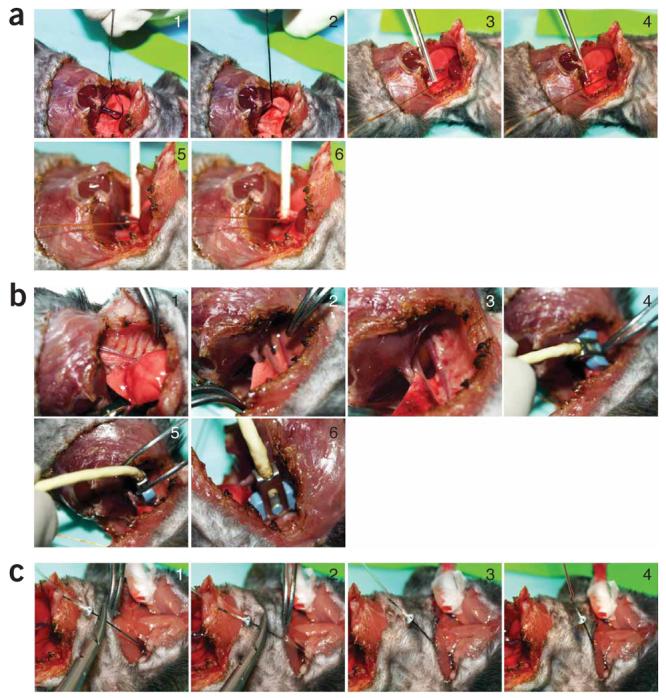
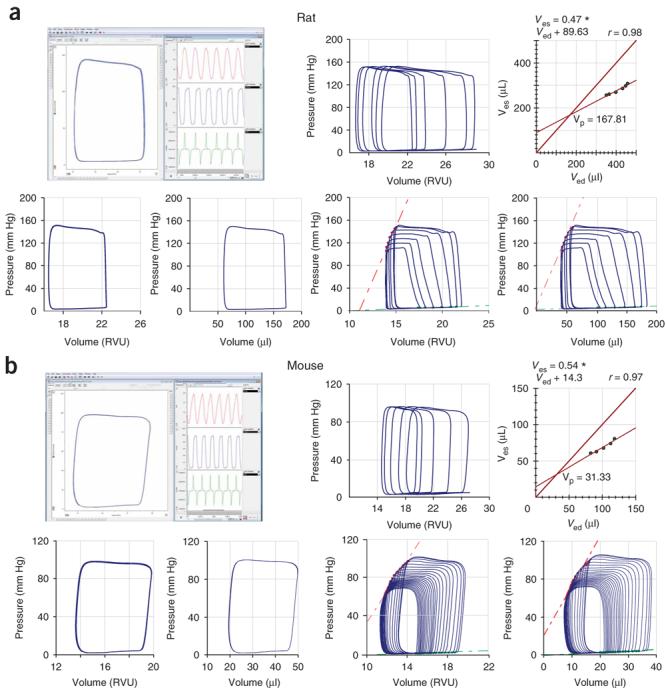
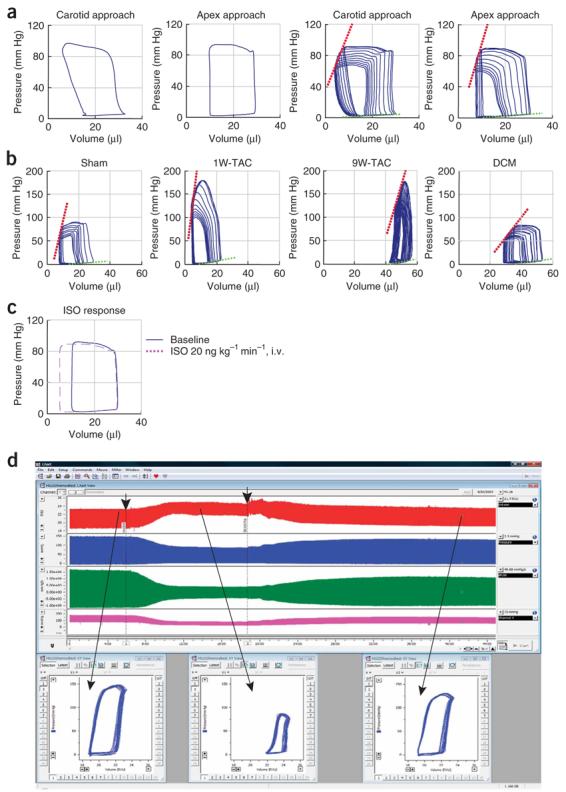
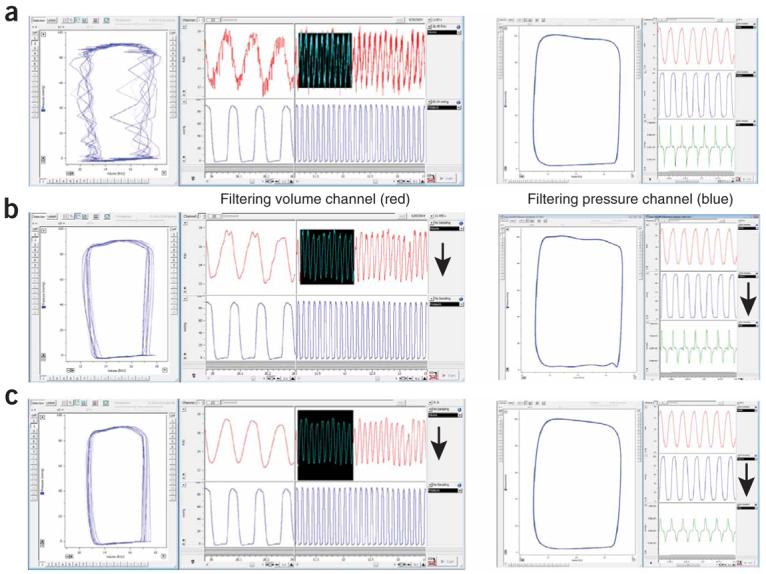
Ventricular pressure-volume relationships have become well established as the most rigorous and comprehensive ways to assess intact heart function. Thanks to advances in miniature sensor technology, this approach has been successfully translated to small rodents, allowing for detailed characterization of cardiovascular function in genetically engineered mice, testing effects of pharmacotherapies and studying disease conditions. This method is unique for providing measures of left ventricular (LV) performance that are more specific to the heart and less affected by vascular loading conditions. Here we present descriptions and movies for procedures employing this method (anesthesia, intubation and surgical techniques, calibrations). We also provide examples of hemodynamics measurements obtained from normal mice/rats, and from animals with cardiac hypertrophy/heart failure, and describe values for various useful load-dependent and load-independent indexes of LV function obtained using different types of anesthesia. The completion of the protocol takes 1-4 h (depending on the experimental design/end points).


Figures

Figure 1
Figure 1
Pressure–volume (PV) catheters and main steps of the protocol. (a) Mouse and rat PV catheters (magnified image) and working principle. (b) Flow chart indicates main procedures and important considerations of the PV protocol.
Figure 2
Figure 2
Intubation techniques. (a) Shows a less invasive technique without tracheal incision which requires more experience; (b) shows a more invasive, but simpler technique. The technique shown in (b) is recommended, because the tracheal tube is more secured allowing less chance for accidental sliding out from the trachea during the surgery/measurements. Sequentially numbered panels indicate stages of the procedure for intubation (see also Supplementary Movie 1 online).
Figure 3
Figure 3
Surgical procedures for LV catheterization. (a) Closed-chest approach: insertion of the catheter into the LV through right carotid artery (see also Supplementary Movie 2 online). Sequentially numbered panels indicate stages of procedure. Image 11 shows mouse PV catheter in the LV on an echo image. (b) Open-chest approach: insertion of the catheter into the LV following stabbing of the apex with a 25–30 gauge needle through the stab wound (see also Supplementary Movie 3 online). Sequentially numbered panels indicate stages of procedure.
Figure 4
Figure 4
Occlusion techniques, aortic flow measurements and jugular vein injection. (a) Vena cava inferior occlusion techniques. (b) Aortic flow measurements. (c) Jugular vein injection (see also Supplementary Movies 4 and 5 online). Sequentially numbered panels indicate stages of procedure.
Figure 5
Figure 5
Representative examples of rat and mouse baseline PV loops and occlusions. Examples show representative (a) rat and (b) mouse PV loops before the calibration (in RVUs) and following cuvette and saline calibrations (in microliters) obtained by closed-chest approach with Millar PV system and analyzed by PVAN3.5. Upper rows (a and b), left-hand panels show examples of baseline uncalibrated PV loops (rectangular shape, left side of the panel), volume signal (red trace), pressure signal below volume (blue trace) and +dP/dt and −dP/dt derived from the pressure signal (green trace). Upper rows (a and b) in middle and right show examples of hypertonic saline injections (rightward ship of PV loops without decrease in the amplitude) and derived Vp values. Lower rows (a and b) show uncalibrated (in RVUs) and calibrated (in microliters) normal rat and mouse baseline PV loops (left two panels) and loops following inferior vena cava occlusions (right two panels) See also Supplementary Movies 2 and 4 online, and Figure 6a.
Figure 6
Figure 6
Representative normal and pathological mouse baseline PV loops and occlusions, and example of hemodynamic effects of drug in mice and rats. (a) Normal calibrated baseline PV loops and occlusions (calibration was performed on the basis of flow measurements and hypertonic saline injections). Normal baseline PV loops from mice (left two panels) and loops during vena cava inferior occlusions (right two panels) obtained from LV catheterization through right carotid artery (carotid approach) or through ventricular apex (see also Fig. 5 and Supplementary Movies 2-3 online). (b) Characteristic changes in PV relationships obtained by vena cava inferior occlusions in control (sham)mice, 1 and 9 weeks following TAC, and in dilated cardiomyopathy (DCM). (c) Characteristic changes in baseline (blue continuous trace) PV relationships during isoproterenol (ISO, red) infusion. (d) Characteristic changes in rat LV volume (red trace) and pressure (blue trace), +dP/dt and −dP/dt derived from LV pressure signal (green trace), and arterial pressure (purple trace) before (at baseline) or after an administration of a drug with known cardiodepressive properties (a cannabinoid type 1 (CB1) receptor agonist Hu210), followed by the recovery after the administration of the CB1 antagonist SR141716 (drug administrations are indicated by arrows). Lower panels show characteristic PV loops at baseline and following the drug administrations. Note that even without any calibrations, the volume traces and PV relationships are very informative.
Figure 7
Figure 7
Representative example of noise and effects of filtration of volume/pressure signal on PV relations. Left column: (a) baseline PV loops with noise showing regular pattern at volume channel, (b) the same following the use of a low-pass 60-Hz digital filter (auto adjust function) or (c) smoothing filter (Triangular (Barlett) window with 25 points) applied to the volume channel (left: PV loops (blue trace), right up and down volume (red trace) and pressure (blue trace) signals, respectively. Figure shows that filtering volume channel may significantly improve the signal without major changes in derived parameters. In this particular case, the noise was originated from electrical network and replugging the system into a stabilized circuit/outlet completely solved the problem (the nature of the noise was also indicated by the noise pattern and the effect of the 60-Hz filter). Right column: (a) baseline normal PV loops, (b) the same following the use of a low-pass 60-Hz digital filter (auto adjust function) or (c) smoothing filter (Triangular (Barlett) window with 25 points) applied to the pressure channel (left: PV loops (blue trace), right up volume (red trace), right middle pressure (blue trace) signals and right down (green trace) +dP/dt and −dP/dt, respectively. The figure shows that filtering of pressure signal may profoundly affect important derived parameters (e.g., +dP/dt and −dP/dt, green traces), which is not desirable. Arrows indicate channels at which filters were applied.

References

    1. Sagawa K, Maughan WL, Suga H, Sunagawa K. Cardiac Contraction and the Pressure–Volume Relationship. Oxford University Press; New York: 1988.
    1. Kass DA, Yamazaki T, Burkhoff D, Maughan WL, Sagawa K. Determination of left ventricular end-systolic pressure–volume relationships by the conductance (volume) catheter technique. Circulation. 1986;73:586–595. - PubMed
    1. Burkhoff D, Mirsky I, Suga H. Assessment of systolic and diastolic ventricular properties via pressure–volume analysis: a guide for clinical, translational, and basic researchers. Am. J. Physiol. Heart Circ. Physiol. 2005;289:H501–H512. - PubMed
    1. Little WC, Cheng CP. Effect of exercise on left ventricular-arterial coupling assessed in the pressure–volume plane. Am. J. Physiol. 1993;264:H1629–H1633. - PubMed
    1. Kass DA, Midei M, Graves W, Brinker JA, Maughan WL. Use of a conductance (volume) catheter and transient inferior vena caval occlusion for rapid determination of pressure–volume relationships in man. Cathet. Cardiovasc. Diagn. 1988;15:192–202. - PubMed

Publication types