. 2008 Sep 5;4(9):e1000148.
doi: 10.1371/journal.ppat.1000148.

Human papillomavirus type 16 entry: retrograde cell surface transport along actin-rich protrusions

Affiliations

Human papillomavirus type 16 entry: retrograde cell surface transport along actin-rich protrusions

Mario Schelhaas et al. PLoS Pathog. .

Abstract

The lateral mobility of individual, incoming human papillomavirus type 16 pseudoviruses (PsV) bound to live HeLa cells was studied by single particle tracking using fluorescence video microscopy. The trajectories were computationally analyzed in terms of diffusion rate and mode of motion as described by the moment scaling spectrum. Four distinct modes of mobility were seen: confined movement in small zones (30-60 nm in diameter), confined movement with a slow drift, fast random motion with transient confinement, and linear, directed movement for long distances. The directed movement was most prominent on actin-rich cell protrusions such as filopodia or retraction fibres, where the rate was similar to that measured for actin retrograde flow. It was, moreover, sensitive to perturbants of actin retrograde flow such as cytochalasin D, jasplakinolide, and blebbistatin. We found that transport along actin protrusions significantly enhanced HPV-16 infection in sparse tissue culture, cells suggesting a role for in vivo infection of basal keratinocytes during wound healing.


Conflict of interest statement

The authors have declared that no competing interests exist.

Figures

Figure 1
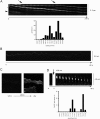
Figure 1. Covalent labeling of HPV-16 PsV with fluorophores.
Purified HPV-16 PsV were covalently labeled with fluorophore-(AF488, FITC)-succinimidylester as described in Materials and Methods. After purification the labeled PsV were analyzed as follows. (A) SDS-gel electrophoresis of AF488 labeled HPV-16 PsV, from left to right: coomassie staining, UV emission, western blot with an antibody directed against L1. (B) AF488 labeled HPV-16 PsV particles bound to glass coverslips, confocal microscopy image (left). Depicted is a representative fluorescence intensity profile (right) of the white encircled AF488 labeled HPV-16 particle (left). The fluorescent signal of AF488 HPV-16 particles matched the signals of labeled Simian Virus 40 particles that are similar in size indicating the absence of bigger aggregates (not shown). (C) Electron micrographs of negatively stained HPV-16 PsV (top), or AF488 labeled HPV-16 PsV (bottom). Bars represent 40 nm. (D) HeLa cells were inoculated with either unlabeled or fluorophore labeled HPV-16 PsV (each about 50 particles/cell) to result in about 30% RFP expressing cells. The percentage of cells expressing RFP (infected cells) was determined by flow cytometric analysis 24 h post inoculation after trypsinization and subsequent fixation by 4% formaldehyde. The graph shows the relative amount of infected cells normalized to the unlabeled virus preparation. Error bars represent the standard deviation of three independent experiments. Numbers below the graph indicate unnormalized infection data (infection). (E) Wide field microscopy of a HeLa cells inoculated for 5 min (37°C) with AF488 labeled HPV-16 PsV (100 particles/cell) with DIC image (left), and AF488 fluorecence (right).
Figure 2
Figure 2. HPV-16 cell surface dynamics.
HeLa cells were inoculated on 18 mm coverslips with HPV-16 PsV (about 100 particles/cell) for 5 min (A–E, H), or for 5–120 min (F, G) at 37°C prior to acquisition of images. (A) Differential interference contrast (DIC) picture of the cell shown in (B). (B) TIRF-M image from a time series (20 Hz, 1000 frames). (C) Trajectories of surface bound HPV-16 PsV from the inset (A, B) were detected by AF488 fluorescence (Scale bar for A–C 10 µm). (D) Representative trajectories of the four different modes of motion: (1) directed movement, (2) constraint diffusion, (3) slow drift, and (4) stationary particle (scale bar 1 µm). (E) Scatter plot of the diffusion coefficient versus the slope of the moment scaling spectrum (SMSS) of HPV-16 PsV trajectories. Every point represents one trajectory. The dots marked 1–4 represent the virus trajectories shown in (D). (F) Representative trajectories of HPV-16 PsV on cellular extensions in two different modes of motion: (1) directed movement, (2) constraint diffusion (Scale bar 1 µm). (G) Scatter plot of the diffusion coefficient versus the slope of the moment scaling spectrum (SMSS) of HPV-16 PsV trajectories on cellular extensions. Points represent the median of all trajectories that have a value for the SMSS either above or below 0,5. Error bars represent the lowest or highest respective values of the two populations (SMSS>0.5, n = 29; SMSS<0.5, n = 27). (H) Confocal images of HeLa cells expressing EGFP-actin, with (right, 50 particles/cell) or without (left) HPV-16 PsV bound.
Figure 3
Figure 3. HPV-16 binds to and is transported on cell protrusions extracellularly.
HPV-16 PsVs were covalently labeled with FITC and about 40 particles /cell were added to HeLa cells for 5 min. prior to image acquisition by epifluorescence microscopy at 2 fps. After 200 frames the extracellular medium was acidified to pH 5.5. (A) Stills show the FITC channel prior to and after acidification. (B) The boxed area of (A) was converted to a kymograph over 240 frames showing every fourth frame with the bottom representing the cell body. (C–G) HeLa cells were inoculated with HPV-16 PsV for 10 min (C, E, F) or 1 h (D, G) and processed for thin section electron microscopy. Viral particles were found to bind to cellular protrusions exclusively outside of the plasma membrane. Bars represent 500 nm (C, D) or 100 nm (E–G).
Figure 4
Figure 4. Directed virus movement along actin protrusions is slow and coincides with actin retrograde flow.
HeLa cells were transfected with EGFP-actin and subsequently inoculated with AF488 labeled HPV-16 PsV (20–100 particles/cell) or SV40 (10 particles/cell). 20 min after virus addition cells were imaged at 2 fps with spinning disc confocal microscopy. (A) Kymograph shows pictures of a single actin protrusion of HeLa cells with several HPV-16 particles bound from time series (2 s intervals) oriented such that the tip of a protrusion is at the top and the cell body at the bottom. The slopes of viral particle location over time reflect the speed by which particles moved from the tip to the bottom of an actin protrusion. The speeds for 242 particles in directed motion from 35 movies were calculated, and displayed as the number of particles moving within a certain speed category. (B) Kymograph shows pictures from time series of a single actin protrusion of HeLa cells with a SV40 particle bound. (C) Confocal image of a single HeLa cell expressing beta-actin tagged with photoactivatable GFP prior to and after activation of PAGFP with short wavelength (405 nm) light. (D) Kymograph of a single protrusion of a HeLa cell expressing PAGFP-actin that was spot-activated with focussed short wavelength (405 nm) laser light. The GFP emission of the single spot showed an F-actin patch moving towards the cell body (bottom) reflecting retrograde flow. The speed of actin retrograde flow within protrusions was calculated and displayed as the number of spots moving within a certain speed category.
Figure 5
Figure 5. Pertubation of actin polymerisation dynamics and myosin II function abrogates virus transport.
HeLa cells were transfected with EGFP-actin and subsequently inoculated with HPV-16 PsV (20–100 particles/cell). 5–15 min after virus addition cells were imaged at 2 fps with spinning disc confocal microscopy. About 1 min after image acquisition started various inhibitors were added as indicated. Kymographs show pictures of single actin protrusions of HeLa cells from time series (2 s intervals) oriented such that tip of protrusions are at the top and the cell body at the bottom. (A) Addition of the microtubule dissociating agent nocodazole (5 µM) does not perturb directed virus movement or protrusion structure. (B) Addition of the actin depolymerising agent cytochalasin D (2 µM) slows directed virus movement over a time period of 10–60 s whereafter the virus is either stuck or switches to random diffusion. (C) Addition of the actin stabilizing drug jasplakinolide (300 nM) similarly slows directed virus movement over a time period of 10–60 s whereafter the virus is either stuck or switches to random diffusion. It is interesting to note that the signal for actin frequently increased in the lower half of the protrusion. (D) Addition of the specific myosin II inhibitor blebbistatin (30 µM) almost instantaneously abrogated directed virus movement whereafter the virus more frequently diffused randomly on the protrusion. (E) Summary of the effects of inhibitors: The number of virus particles initially detected in directed motion was set to 100% and compared to the number of particles that still moved in a directed fashion after 80 s (inhibitor concentrations: 50 µM for ML-7, 10 mM for sodium azide). The number of particles analyzed was as follows: nocodazole, n = 143; cytochalasin D, n = 262; jasplakinolide, n = 33; blebbistatin, n = 219; ML-7, n = 39; sodium azide, n = 27.
Figure 6
Figure 6. Inhibition of virus transport in keratinocytes and HeLa cells reduces the efficiency of infection.
(A) HeLa cells were infected with HPV-16 PsV (about 50 particles/cell) expressing GFP with or without inhibition of actin retrograde flow by blebbistatin. Cells were grown as confluent monolayers without the presence of long actin protrusions or subconfluently exhibiting frequently actin protrusions. The number of cells showing GFP expression (infected cells, about 30%) was scored 24 h after addition of virus and the data was normalized to the unperturbed controls. The graph shows the relative amount of infected cells normalized to virus infection in the absence of blebbistatin. Error bars represent the standard deviation of three independent experiments. Numbers below the graph indicate unnormalized infection data. (A) HaCaT cells were transfected with EGFP-actin and subsequently inoculated with AF488 labeled HPV-16 PsV (100 particles/cell). 30 min after virus addition cells were imaged at 1 fps with spinning disc confocal microscopy. Kymograph shows pictures of a single actin protrusion of HaCaT cells from time series (5 s intervals) oriented such that tip of protrusions are at the top and the cell body at the bottom. (B) HeLa or HaCaT cells were infected with HPV-16 PsV expressing GFP (50 or 30 particles/cell, respectively) with or without inhibition of actin retrograde flow by blebbistatin. Cells were grown as confluent monolayers without the presence of long actin protrusions or subconfluently exhibiting frequently actin protrusions. The percentage of cells showing GFP expression (infected cells, 30–40%) was scored 36 h after addition of virus and the data was normalized to the unperturbed controls. The graph shows the relative amount of infected cells normalized to virus infection in the absence of blebbistatin. Error bars represent the standard deviation of three independent experiments. Numbers below the graph indicate unnormalized infection data (infection).

Similar articles

Cited by

References

    1. Marsh M, Helenius A. Virus entry: open sesame. Cell. 2006;124:729–740. - PMC - PubMed
    1. Ewers H, Smith AE, Sbalzarini IF, Lilie H, Koumoutsakos P, et al. Single-particle tracking of murine polyoma virus-like particles on live cells and artificial membranes. Proc Natl Acad Sci U S A. 2005;102:15110–15115. - PMC - PubMed
    1. Lehmann MJ, Sherer NM, Marks CB, Pypaert M, Mothes W. Actin- and myosin-driven movement of viruses along filopodia precedes their entry into cells. J Cell Biol. 2005;170:317–325. - PMC - PubMed
    1. Buck CB, Cheng N, Thompson CD, Lowy DR, Steven AC, et al. Arrangement of L2 within the Papillomavirus capsid. J Virol. 2008;82:5190–5197. - PMC - PubMed
    1. Roberts JN, Buck CB, Thompson CD, Kines R, Bernardo M, et al. Genital transmission of HPV in a mouse model is potentiated by nonoxynol-9 and inhibited by carrageenan. Nat Med. 2007;13:857–861. - PubMed

Publication types