. 2008 Sep 5;3(9):e3149.
doi: 10.1371/journal.pone.0003149.

A beta-lactam antibiotic dampens excitotoxic inflammatory CNS damage in a mouse model of multiple sclerosis

Affiliations

A beta-lactam antibiotic dampens excitotoxic inflammatory CNS damage in a mouse model of multiple sclerosis

Nico Melzer et al. PLoS One. .

Erratum in

  • PLoS ONE. 2008;3(9). doi: 10.1371/annotation/b898d6ee-801a-474e-9776-72e4da664b89
  • PLoS One. 2011;6(1). doi: 10.1371/annotation/b1ff1c14-fa84-40a0-b095-e5ee47c74125

Abstract

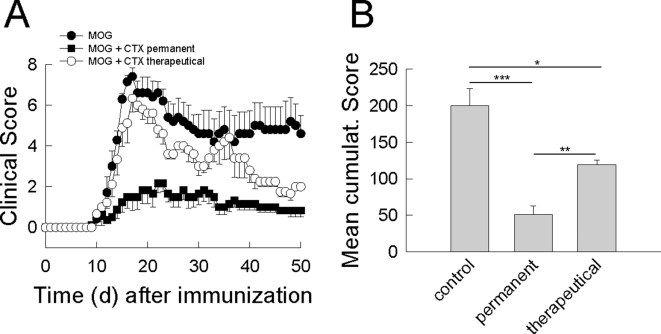
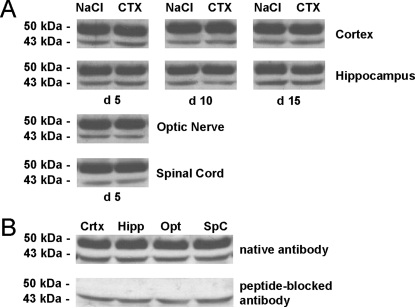
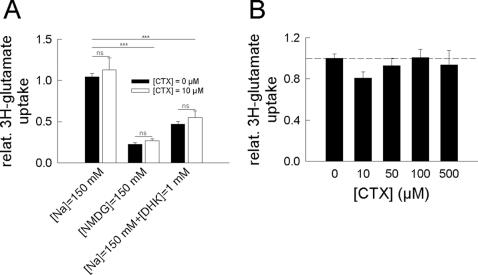
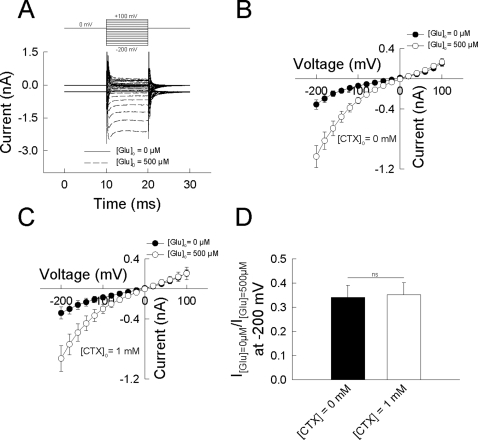
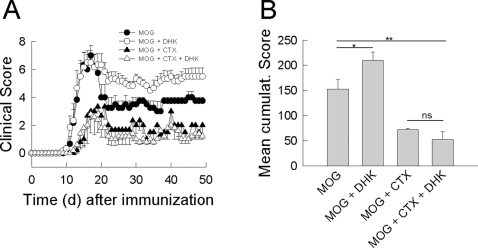
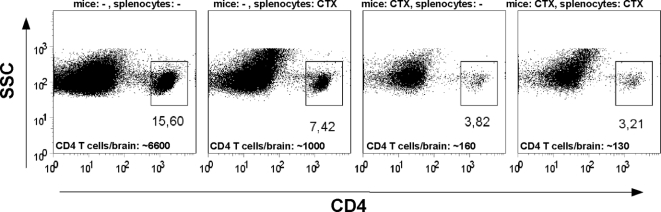
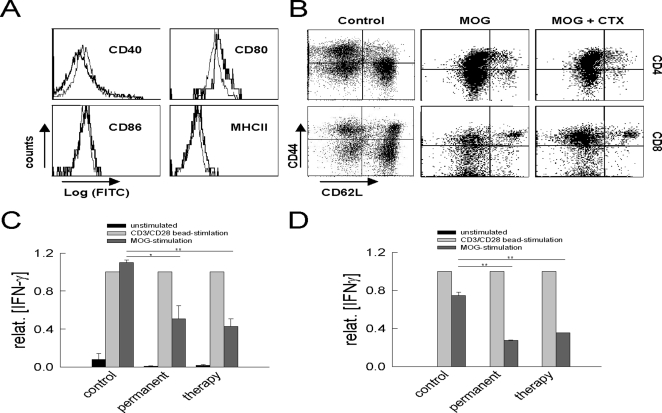
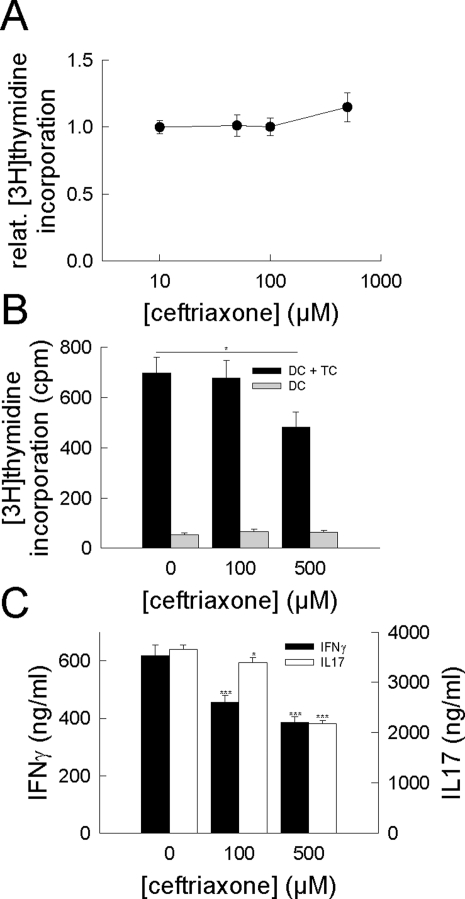
In multiple sclerosis (MS) and its animal model experimental autoimmune encephalomyelitis (EAE), impairment of glial "Excitatory Amino Acid Transporters" (EAATs) together with an excess glutamate-release by invading immune cells causes excitotoxic damage of the central nervous system (CNS). In order to identify pathways to dampen excitotoxic inflammatory CNS damage, we assessed the effects of a beta-lactam antibiotic, ceftriaxone, reported to enhance expression of glial EAAT2, in "Myelin Oligodendrocyte Glycoprotein" (MOG)-induced EAE. Ceftriaxone profoundly ameliorated the clinical course of murine MOG-induced EAE both under preventive and therapeutic regimens. However, ceftriaxone had impact neither on EAAT2 protein expression levels in several brain areas, nor on the radioactive glutamate uptake capacity in a mixed primary glial cell-culture and the glutamate-induced uptake currents in a mammalian cell line mediated by EAAT2. Moreover, the clinical effect of ceftriaxone was preserved in the presence of the EAAT2-specific transport inhibitor, dihydrokainate, while dihydrokainate alone caused an aggravated EAE course. This demonstrates the need for sufficient glial glutamate uptake upon an excitotoxic autoimmune inflammatory challenge of the CNS and a molecular target of ceftriaxone other than the glutamate transporter. Ceftriaxone treatment indirectly hampered T cell proliferation and proinflammatory INFgamma and IL17 secretion through modulation of myelin-antigen presentation by antigen-presenting cells (APCs) e.g. dendritic cells (DCs) and reduced T cell migration into the CNS in vivo. Taken together, we demonstrate, that a beta-lactam antibiotic attenuates disease course and severity in a model of autoimmune CNS inflammation. The mechanisms are reduction of T cell activation by modulation of cellular antigen-presentation and impairment of antigen-specific T cell migration into the CNS rather than or modulation of central glutamate homeostasis.


Conflict of interest statement

Competing Interests: The authors have declared that no competing interests exist.

Figures

Figure 1
Figure 1. A β-lactam antibiotic profoundly attenuates the clinical course of MOG-induced EAE in mice.
(A) Time course of neurological symptoms after immunization of WT C57BL/6 mice with a MOG peptide (MOG35–55). Mice were treated with ceftriaxone (200 mg/kg/d i.p.) either from the day of immunization (MOG+CTX permanent; filled squares) or from the individual onset of symptoms (MOG+CTX therapeutic; empty circles). MOG-immunized control mice (MOG) were injected with an equivalent volume of saline (MOG; filled circles). The degree of neurological impairment was assessed using a 10-point scoring system. (B) Mean cumulative score of MOG immunized mice treated with saline (control; n = 8) and with ceftriaxone from the day of immunization (permanent; n = 8) or from the individual onset of symptoms (therapeutical; n = 8). Differences between the 3 experimental groups are significant (control vs. permanent: p<0.001 ***; control vs. therapeutical: p = 0.05 *; permanent vs. therapeutical: p<0.01 **).
Figure 2
Figure 2. Ceftriaxone does not alter EAAT2 protein expression in several brain areas in mice.
(A) Non-immunized mice were treated for 15 day either with ceftriaxone (CTX; 200 mg/kg/d i.p.) or an equal volume of saline (NaCl). No alteration of EAAT2 protein (50 kDa) expression levels could be observed in cortex, hippocampus, optic nerve and spinal cord after 5, 10 and 15 days of treatment assessed by western-blot analysis. (B) Specificity of antibody binding to the EAAT2 protein was confirmed using the immunogenic peptide to block the antibody (lower lane) that was used to detect the EAAT2 protein in the different brain areas after 5 day of treatment (upper lane). With the peptide-blocked antibody the 50 kDa band was virtually absent in samples from all brain areas tested, demonstrating specific binding of the antibody to the solubilized EAAT2 protein during western blotting. β-actin (43 kDa) was used as protein loading control.
Figure 3
Figure 3. Dihydrokainate-sensitive radioactive glutamate uptake in a rat primary mixed glial cell culture is not influenced by ceftriaxone.
(A) [3H]-glutamate (60 µM) uptake was measured in a rat primary mixed glial cell culture after 5 day of incubation with (white bars) or without (black bars) 10 µM ceftriaxone using either a NaCl-based external solution in the absence (left) or the presence (right) of 1 mM dihydrokainate or using a sodium-free NMDG-Cl-based external solution (middle). Substitution of external sodium by NMDG significantly reduced the uptake in the absence as well as in the presence of ceftriaxone (0.22±0.02 and 0.27±0.02, respectively; n = 3 trials consisting of 2 samples each; p<0.001 ***). Dihydrokainate lowered glutamate uptake to 0.47±0.03 in the absence and 0.55±0.08 in the presence of ceftriaxone (n = 3 trials consisting of 2 samples each; p<0.001 ***). (B) A ceftriaxone concentration-dependence of the [3H]-glutamate uptake could not be observed after 5 days of incubation with concentrations between 0 and 500 µM (p([ceftriaxone] = 0 µM vs. [ceftriaxone] = 500 µM) = 0.19; n = 3 trials consisting of 6 samples).
Figure 4
Figure 4. Ceftriaxone exerts no effect on the EAAT2-mediated electrical uptake current in a mammalian cell line.
(A) Representative current traces recorded from a tsA 201 cell heterologously expressing hEAAT2 in the absence and the presence of 500 µM glutamate. The cell was held a 0 mV and 10 ms voltage-steps to potentials between −200 mV and 100 mV were applied. (B, C) Voltage-dependence of hEAAT2 mediated currents in the absence (filled circles) and the presence (empty circles) of 500 µM after pre-incubation with 0 mM (B) and 1 mM (C) ceftriaxone. (D) Inverse of the glutamate-induced current increase determined at −200 mV after pre-incubation with 0 mM (black bar) and 1 mM (white bar) ceftriaxone. Current ratios are not significantly different (p = 0.87; n = 6 individual cells, respectively).
Figure 5
Figure 5. Ceftriaxone attenuates the clinical EAE course in mice in the presence of the EAAT2 transport inhibitor dihydrokainate.
(A) Time course of neurological symptoms after immunization of WT C57BL/6 mice with human recombinant MOG. Mice were treated from the day of immunization with ceftriaxone alone (MOG+CTX; filled triangles; 200 mg/kg/d i.p.) or in combination with dihydrokainate (MOG+CTX+DHK; 10 mg/kg/d i.p.; empty triangles). MOG-immunized control mice were injected with an equivalent volume of saline alone (MOG; filled circles) or together with dihydrokainate (MOG+DHK; empty circles). The degree of neurological symptoms was assessed using a 10-point scoring system. (B) Mean cumulative score of mice from the different experimental groups. Differences between the experimental groups are significant (MOG vs. MOG+ceftriaxone: p = 0.004 **; MOG vs. MOG+ceftriaxone+dihydrokainate: p = 0.004 **; MOG vs. MOG+DHK: p = 0.05 *).
Figure 6
Figure 6. CNS invasion of neuroantigen-specific T cells is impaired by ceftriaxone.
Splenocytes from TCR-transgenic 2D2 mice were stimulated for 5 days with MOG peptide (20 µg/ml) in the presence or absence of 500 µM ceftriaxone in vitro and adoptively transferred into WT C57BL/6 mice (3×10⁶ splenocytes/mice) pre-treated for 5 days with or without ceftriaxone (200 mg/kg i.p.). Dot plot show numbers of CNS invasive CD4+ T cells analysed 4 days after transfer using whole-brain FACS analysis. Mean absolute numbers of T cells/brain calculated from 3 to 4 mice pooled per experimental group are indicated in each histogram.
Figure 7
Figure 7. Ceftriaxone does not modulate phenotypical but functional properties of peripheral immune cells.
(A) FACS-analysis of the activation markers CD40 (upper left), CD80 (upper right), CD86 (lower left) and MHCII (lower right) on CD11b+ CD11c+ APCs from spleen of untreated (thick lines) and ceftriaxone-treated (thin lines) MOG-immunized mice at the disease maximum. Geometric mean fluorescence intensities of all marker were similar between experimental groups. (B) Immunophenotyping of CD4+ (upper panels) and CD8+ (lower panels) T cells from spleen of non-immunized (left panels) as well as untreated (middle) and ceftriaxone-treated (right) MOG-immunized mice. Relative fractions of T cells as assed by CD40 and CD62L expression were similar between experimental groups. (C, D) MOG-recall experiments performed with splenocytes from untreated as well as permanently and therapeutically treated MOG-immunized mice at the disease maximum (C) and in the residual state (D) in the total absence of ceftriaxone in vitro. MOG-specific supernatant IFNγ-levels were significantly reduced relative to antigen-independent CD3/CD28 bead-stimulation in samples from MOG-immunized mice treated with ceftriaxone as compared to untreated MOG-immunized mice at the disease maximum (p (permanent) = 0.02 *; p (therapeutical)<0.01 **) and the residual state (p (permanent)<0.01 **; p (therapeutical)<0.01 **; n = 3 samples out of 3 animals, respectively). There was no difference whether mice were treated permanently or only after disease onset.
Figure 8
Figure 8. Reduced T cell response is due to ceftriaxone-induced modulation of cellular antigen-presentation.
(A) Ceftriaxone concentration-dependence of CD3/CD28 stimulation induced proliferation of murine CD4+ T cells. Ceftriaxone does not inhibit [3H]thymidine incorporation in T cells (p([ceftriaxone] = 0 µM vs. [ceftriaxone] = 500 µM) = 0.12; n = 6 respectively). (B) Proliferation of murine CD4+ T cells (TCs) cocultured with dendritic cells (DCs) previously loaded with MOG peptide (50 µg/ml) in the absence and presence of different ceftriaxone concentrations. MOG-preincubation of dendritic cells in the presence of ceftriaxone impaired subsequent proliferation of T cells (p([ceftriaxone] = 0 µM vs. [ceftriaxone] = 500 µM): p = 0.05 *; n = 6). (C) Ceftriaxone concentration dependence of supernatant IFNγ and IL17 levels from the experiment described in (B). MOG-preincubation of dendritic cells in the presence of ceftriaxone lowered IFNγ and IL17 levels in a concentration dependent manner (p([ceftriaxone] = 0 µM vs. [ceftriaxone] = 500 µM): IFNγ: p<0.001 ***, IL17: p<0.001 ***; n = 6 respectively).

Similar articles

Cited by

References

    1. Frohman EM, Racke MK, Raine CS. Multiple sclerosis–the plaque and its pathogenesis. N Engl J Med. 2006;354:942–955. - PubMed
    1. Sospedra M, Martin R. Immunology of multiple sclerosis. Annu Rev Immunol. 2005;23:683–747. - PubMed
    1. Gold R, Linington C, Lassmann H. Understanding pathogenesis and therapy of multiple sclerosis via animal models: 70 years of merits and culprits in experimental autoimmune encephalomyelitis research. Brain. 2006;129:1953–1971. - PubMed
    1. Bjartmar C, Trapp BD. Axonal and neuronal degeneration in multiple sclerosis: mechanisms and functional consequences. Curr Opin Neurol. 2001;14:271–278. - PubMed
    1. Werner P, Pitt D, Raine CS. Multiple sclerosis: altered glutamate homeostasis in lesions correlates with oligodendrocyte and axonal damage. Ann Neurol. 2001;50:169–180. - PubMed

Publication types