IL-21 limits peripheral lymphocyte numbers through T cell homeostatic mechanisms
- PMID: 18773086
- PMCID: PMC2527999
- DOI: 10.1371/journal.pone.0003118
IL-21 limits peripheral lymphocyte numbers through T cell homeostatic mechanisms
Abstract
Background: IL-21, a member of the common gamma-chain utilizing family of cytokines, participates in immune and inflammatory processes. In addition, the cytokine has been linked to autoimmunity in humans and rodents.
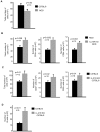
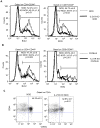
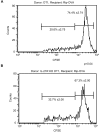
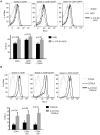
Methodology/principal findings: To investigate the mechanism whereby IL-21 affects the immune system, we investigated its role in T cell homeostasis and autoimmunity in both non-autoimmune C57BL/6 and autoimmune NOD mice. Our data indicate that IL-21R knockout C57BL/6 and NOD mice show increased size of their lymphocyte population and decreased homeostatic proliferation. In addition, our experimental results demonstrate that IL-21 inhibits T cell survival. These data suggest that IL-21 acts to limit the size of the T cell pool. Furthermore, our data suggest IL-21 may contribute to the development of autoimmunity.
Conclusions/significance: Taken together, our results suggest that IL-21 plays a global role in regulating T cell homeostasis, promoting the continuous adaptation of the T cell lymphoid space.
Conflict of interest statement
Figures
Similar articles
-
IL-21 inhibits T cell IL-2 production and impairs Treg homeostasis.Blood. 2012 May 17;119(20):4656-64. doi: 10.1182/blood-2011-10-388546. Epub 2012 Mar 22. Blood. 2012. PMID: 22442347
-
A positive feedback loop of IL-21 signaling provoked by homeostatic CD4+CD25- T cell expansion is essential for the development of arthritis in autoimmune K/BxN mice.J Immunol. 2009 Apr 15;182(8):4649-56. doi: 10.4049/jimmunol.0804350. J Immunol. 2009. PMID: 19342640
-
IL-21 modulates CD4+ CD25+ regulatory T-cell homeostasis in experimental autoimmune encephalomyelitis.Scand J Immunol. 2008 Jan;67(1):37-46. doi: 10.1111/j.1365-3083.2007.02035.x. Scand J Immunol. 2008. PMID: 18052963
-
Clinical significance and immunobiology of IL-21 in autoimmunity.J Autoimmun. 2019 May;99:1-14. doi: 10.1016/j.jaut.2019.01.013. Epub 2019 Feb 14. J Autoimmun. 2019. PMID: 30773373 Review.
-
Biology of IL-21 and the IL-21 receptor.Immunol Rev. 2004 Dec;202:84-95. doi: 10.1111/j.0105-2896.2004.00201.x. Immunol Rev. 2004. PMID: 15546387 Review.
Cited by
-
Probiotic Supplementation Improves Glucose Homeostasis and Modulates Interleukin (IL)-21 and IL-22 Levels in Pediatric Patients with Type 1 Diabetes: A Randomized Placebo-Controlled Trial.Metabolites. 2025 Apr 24;15(5):288. doi: 10.3390/metabo15050288. Metabolites. 2025. PMID: 40422866 Free PMC article.
-
Interleukin-21 receptor-mediated signals control autoreactive T cell infiltration in pancreatic islets.Immunity. 2012 Jun 29;36(6):1060-72. doi: 10.1016/j.immuni.2012.04.005. Epub 2012 May 10. Immunity. 2012. PMID: 22579473 Free PMC article.
-
Cytokines and type 1 diabetes: a numbers game.Diabetes. 2011 Mar;60(3):697-9. doi: 10.2337/db10-1782. Diabetes. 2011. PMID: 21357470 Free PMC article. No abstract available.
-
IL-21 regulates SOCS1 expression in autoreactive CD8+ T cells but is not required for acquisition of CTL activity in the islets of non-obese diabetic mice.Sci Rep. 2019 Oct 25;9(1):15302. doi: 10.1038/s41598-019-51636-5. Sci Rep. 2019. PMID: 31653894 Free PMC article.
-
The PTPN22 1858T allele but not variants in the proximal promoter region of IL-21 gene is associated with the susceptibility to type 1 diabetes and the presence of autoantibodies in a Brazilian cohort.Clin Exp Immunol. 2013 Apr;172(1):16-22. doi: 10.1111/cei.12030. Clin Exp Immunol. 2013. PMID: 23480181 Free PMC article.
References
-
- Leonard WJ, Spolski R. Interleukin-21: a modulator of lymphoid proliferation, apoptosis and differentiation. Nat Rev Immunol. 2005;5:688–698. - PubMed
-
- Coquet JM, Kyparissoudis K, Pellicci DG, Besra G, Berzins SP, et al. IL-21 is produced by NKT cells and modulates NKT cell activation and cytokine production. J Immunol. 2007;178:2827–2834. - PubMed
-
- Nurieva R, Yang XO, Martinez G, Zhang Y, Panopoulos AD, et al. Essential autocrine regulation by IL-21 in the generation of inflammatory T cells. Nature. 2007;448:480–483. - PubMed
-
- Davis ID, Skak K, Smyth MJ, Kristjansen PE, Miller DM, et al. Interleukin-21 signaling: functions in cancer and autoimmunity. Clin Cancer Res. 2007;13:6926–6932. - PubMed
Publication types
MeSH terms
Substances
Grants and funding
LinkOut - more resources
Full Text Sources
Molecular Biology Databases

