. 2008 Sep 5;4(9):e1000170.
doi: 10.1371/journal.pcbi.1000170.

Insights into protein-DNA interactions through structure network analysis

Affiliations

Insights into protein-DNA interactions through structure network analysis

R Sathyapriya et al. PLoS Comput Biol. .

Abstract

Protein-DNA interactions are crucial for many cellular processes. Now with the increased availability of structures of protein-DNA complexes, gaining deeper insights into the nature of protein-DNA interactions has become possible. Earlier, investigations have characterized the interface properties by considering pairwise interactions. However, the information communicated along the interfaces is rarely a pairwise phenomenon, and we feel that a global picture can be obtained by considering a protein-DNA complex as a network of noncovalently interacting systems. Furthermore, most of the earlier investigations have been carried out from the protein point of view (protein-centric), and the present network approach aims to combine both the protein-centric and the DNA-centric points of view. Part of the study involves the development of methodology to investigate protein-DNA graphs/networks with the development of key parameters. A network representation provides a holistic view of the interacting surface and has been reported here for the first time. The second part of the study involves the analyses of these graphs in terms of clusters of interacting residues and the identification of highly connected residues (hubs) along the protein-DNA interface. A predominance of deoxyribose-amino acid clusters in beta-sheet proteins, distinction of the interface clusters in helix-turn-helix, and the zipper-type proteins would not have been possible by conventional pairwise interaction analysis. Additionally, we propose a potential classification scheme for a set of protein-DNA complexes on the basis of the protein-DNA interface clusters. This provides a general idea of how the proteins interact with the different components of DNA in different complexes. Thus, we believe that the present graph-based method provides a deeper insight into the analysis of the protein-DNA recognition mechanisms by throwing more light on the nature and the specificity of these interactions.


Conflict of interest statement

The authors have declared that no competing interests exist.

Figures
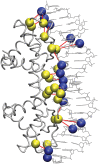
Figure 1
Figure 1. A bipartite graph representation of the amino acid–nucleotide interactions in a protein–DNA complex.
In the bipartite graph representation of the protein–DNA complex, the amino acids and the nucleotides of the DNA form the two node sets. Shown in yellow are amino acid nodes, and blue, the nucleotides. The edges (between the nodes from one set to the other) are shown in red. These edges are defined based on a specific MEC. The MEC quantifies the minimum number of atomic contacts expected between an amino acid and a nucleotide to define an edge (Equation 1). The contacts are specifically evaluated between side chains of the amino acids and the phosphate, or the deoxyribose sugar or the base of nucleotides to form the P-p, P-S, and P-B clusters, respectively.
Figure 2
Figure 2. Amino acid propensities in PDGs.
Amino acid propensities in the different component graphs are calculated in the OMEC range. The propensity for a particular amino acid “i” (Pi) is calculated as formula image where formula image is the number of occurrences of the amino acid “i” in a PDG of protein–DNA complex “n” and N is the total number of structures in the dataset. The figure shows the propensities of amino acids in all the component graphs across the whole dataset.
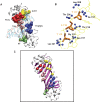
Figure 3
Figure 3. Protein-deoxyribose (P-S) clusters in β-sheet group.
(a) Different P-S clusters in the TATA binding protein (1tgh) (at MEC 7%) are shown in different colors with their amino acid composition. (b) A P-S cluster is shown in detail to reveal the tight interactions between the amino acids (blue) and the deoxyribose (orange) of the nucleotides. (c) Only the Cα of the amino acids of the P-S clusters is highlighted in the sheets named from A to J.
Figure 4
Figure 4. A protein-base (P-B) hub in TATA box binding protein (TBP/DNA).
An amino acid interacts with four different bases to form a P-B hub. In the TATA box binding protein (1tgh) the position of a P-B hub Phe193 (at MEC 3%) is shown. This hub (blue) interacts mainly with bases from four different nucleotides (red) T115, A116, T109, and A110.
Figure 5
Figure 5. P-p, P-S, and P-B clusters in the β-hairpin group protein Arc (1bdt).
In the Arc protein (1bdt), the P-p (yellow), P-S (green), and P-B (blue) clusters are shown. The β-hairpin that is interacting with the DNA is highlighted in red. A cluster of charged residues (Arg, Asn, and Gln) from the β-hairpin makes contact with successive bases of the DNA. These P-B clusters are flanked by the P-S and P-p clusters arising from other secondary structures (helices and loops) around the β-ribbon. A P-p hub (orange) in which the phosphate group of Ade4 interacts with Ser32, Val33 and Phe10 is also highlighted.
Figure 6
Figure 6. Clusters (P-p, P-S, and P-B) from the 434 repressor protein of the HTH group.
The P-p (yellow), P-S (green), and P-B (blue) clusters are shown in the bacteriophage 434 repressor protein (1rpe) which belongs to the HTH group. The P-B clusters are present in the recognition helix that interacts with the major groove of the DNA and the P-p and the P-S clusters are present in the other interacting region that interacts with the minor groove.
Figure 7
Figure 7. Interaction of the transcription factor Max (1hlo) of the zipper-type group (basic-helix-loop-helix-zipper) with DNA.
The Max transcription factor, which belongs to the Helix-Loop-Helix Zipper family, has a dimerization domain and a DNA binding domain (center). The DNA binding domain shows the presence of symmetric P-p (yellow) and asymmetric P-B clusters (blue) (upper and lower). The cluster compositions are given (single letter code for nodes: upper case for amino acids and lower case for nucleotides). The cluster compositions for other proteins are given in Table S2. There is a marked absence of P-S clusters in the recognition of DNA by this zipper protein.
Figure 8
Figure 8. An overview of differences in the pattern of clusters observed due to the presence of linker in the nucleosome core particle.
The superposition of the two structures is done using Align. (Only 1aoi is represented in the above figure for clarity.) The clusters that remain unperturbed in both the structures are given in red. The new clusters that are formed due to the conformational changes mediated by the presence of the linker are given in blue. Significant P-B clusters were not seen in both the structures. The composition of the clusters in the linker region is given in Table S4.

Similar articles

Cited by

References

    1. Luscombe NM, Thornton JM. Protein–DNA interactions: amino acid conservation and the effects of mutations on binding specificity. J Mol Biol. 2002;320:991–1009. - PubMed
    1. Lustig B, Jernigan RL. Consistencies of individual DNA base–amino acid interactions in structures and sequences. Nucleic Acids Res. 1995;23:4707–4711. - PMC - PubMed
    1. Prabakaran P, Siebers JG, Ahmad S, Gromiha MM, Singarayan MG, et al. Classification of protein-DNA complexes based on structural descriptors. Structure. 2006;14:1355–1367. - PubMed
    1. Sathyapriya R, Brinda KV, Vishveshwara S. Correlation of the side-chain hubs with the functional residues in DNA binding protein structures. J Chem Inf Model. 2006;46:123–129. - PubMed
    1. Luscombe NM, Laskowski RA, Thornton JM. Amino acid–base interactions: a three-dimensional analysis of protein–DNA interactions at an atomic level. Nucleic Acids Res. 2001;29:2860–2874. - PMC - PubMed

Publication types