. 2008;10(4):333-42.
doi: 10.1007/s12017-008-8047-9. Epub 2008 Sep 5.

Coupling endoplasmic reticulum stress to the cell death program in dopaminergic cells: effect of paraquat

Affiliations

Coupling endoplasmic reticulum stress to the cell death program in dopaminergic cells: effect of paraquat

Shankar J Chinta et al. Neuromolecular Med. 2008.

Abstract

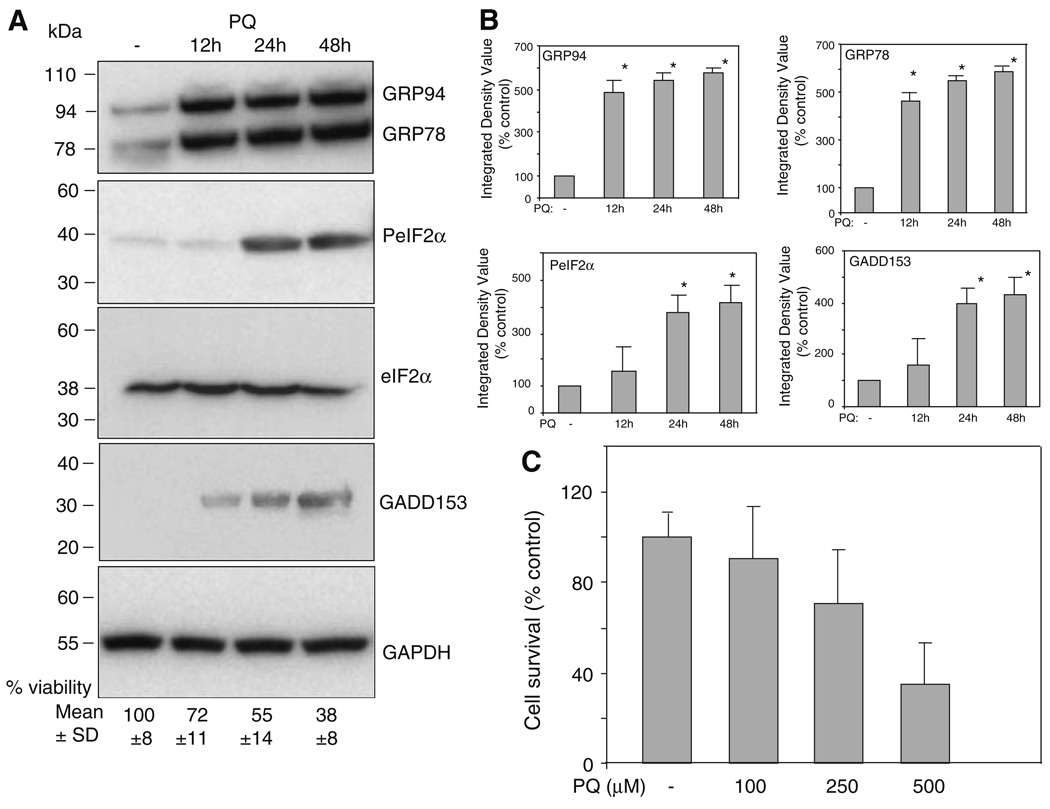
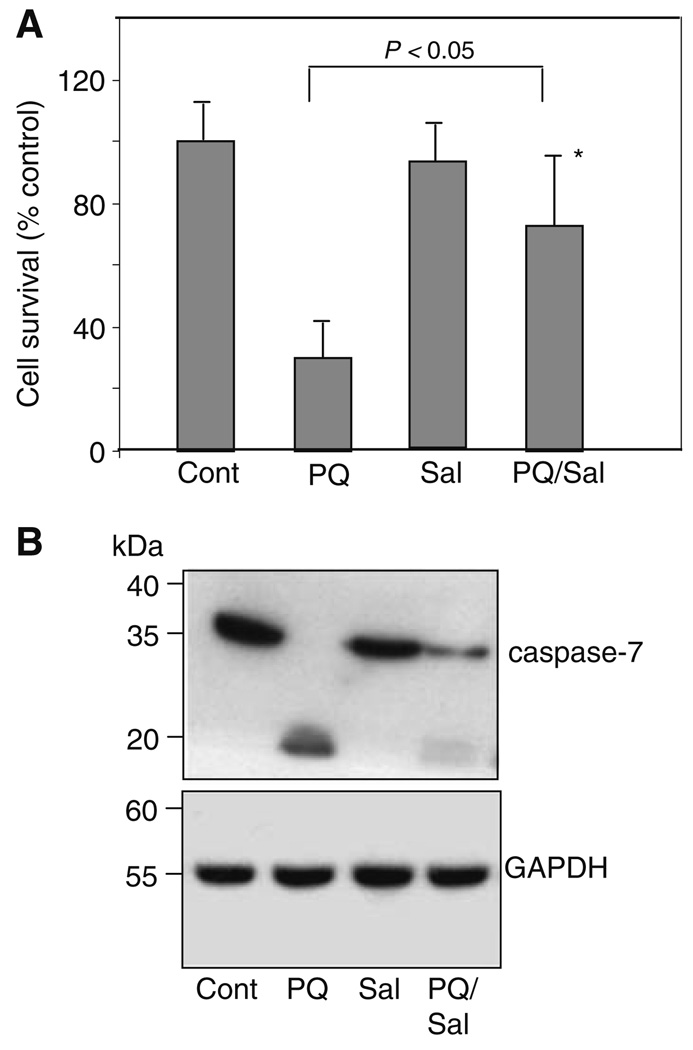
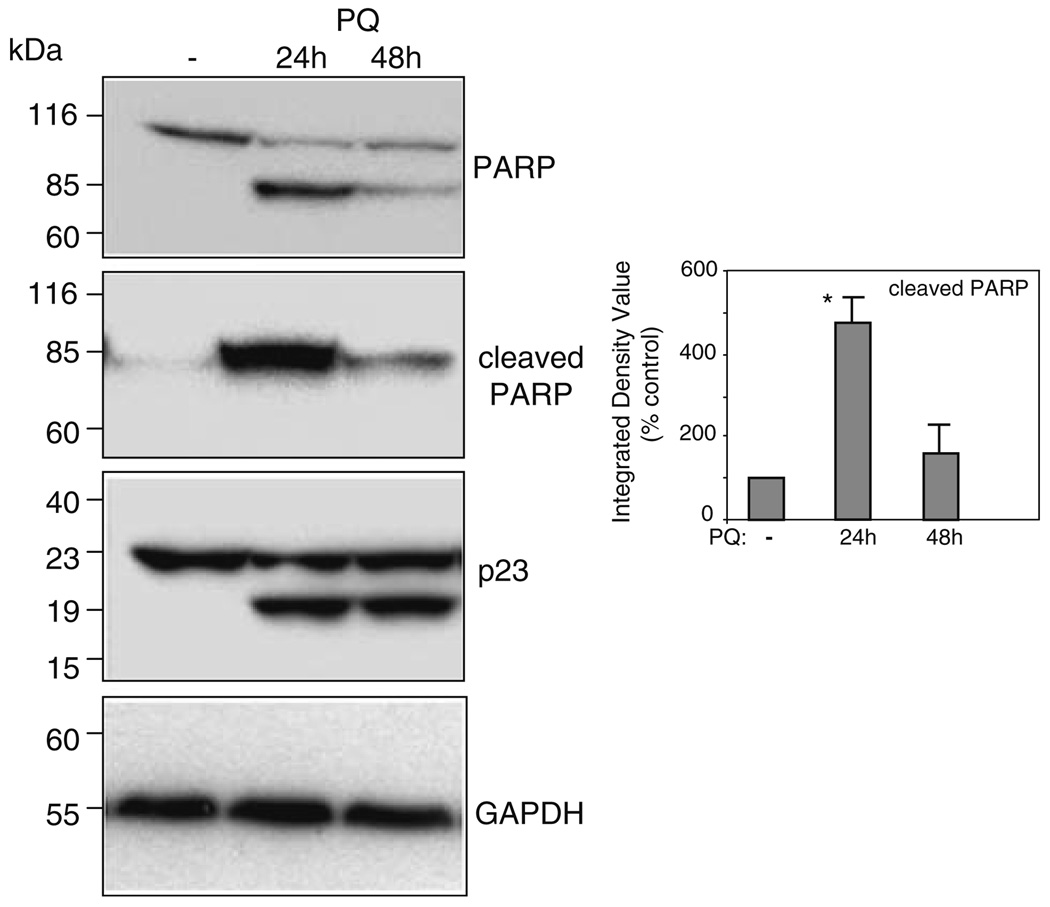
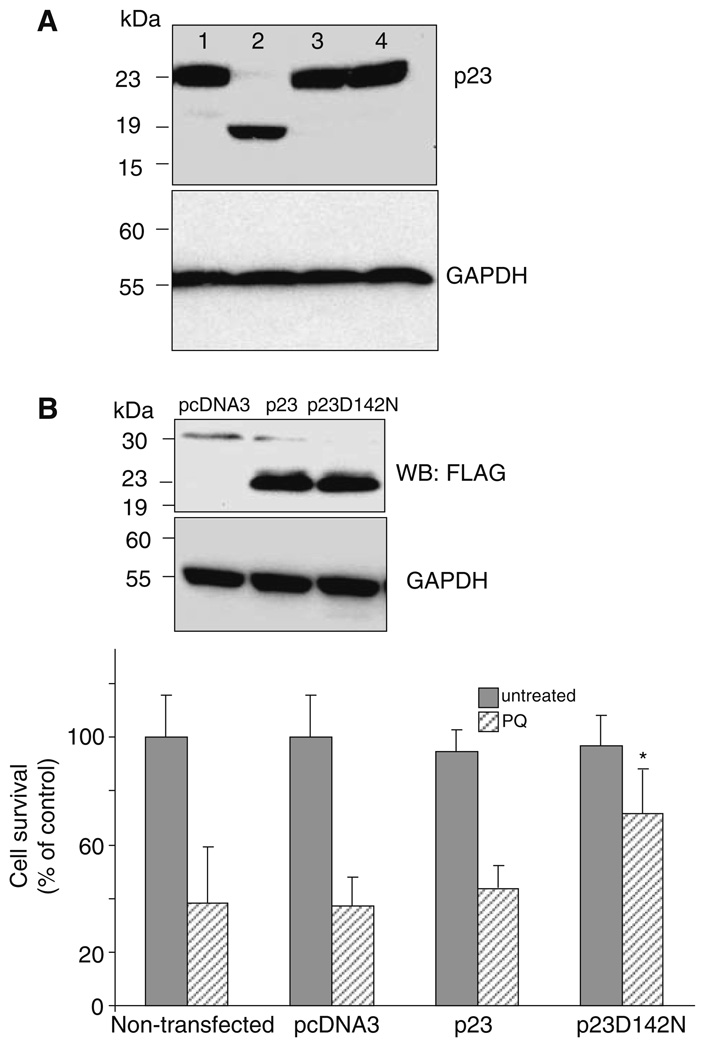
Parkinson's disease (PD) features oxidative stress and accumulation of misfolded (unfolded, alternatively folded, or mutant) proteins with associated loss of dopaminergic neurons. Oxidative stress and the accumulated misfolded proteins elicit cellular responses that include an endoplasmic reticulum (ER) stress response that may protect cells against the toxic buildup of misfolded proteins. Chronic ER stress and accumulation of misfolded proteins in excessive amounts, however, overwhelm the cellular 'quality control' system and impair the protective mechanisms designed to promote correct folding and degrade faulty proteins, ultimately leading to organelle dysfunction and neuronal cell death. Paraquat belongs to a class of bipyridyl herbicides and triggers oxidative stress and dopaminergic cell death. Epidemiological studies suggest an increased risk for developing PD following chronic exposure to paraquat. The present study was carried out to determine the role of paraquat in triggering cellular stress particularly ER stress and to elucidate the pathways that couple ER stress to dopaminergic cell death. We demonstrate that paraquat triggers ER stress, cell dysfunction, and dopaminergic cell death. p23, a small co-chaperone protein, is cleaved during ER stress-induced cell death triggered by paraquat and blockage of the caspase cleavage site of p23 was associated with decreased cell death. Paraquat also inhibits proteasomal activity that may further trigger accumulation of misfolded proteins resulting in ER stress. Our results indicate a protective role for p23 in PD-related programmed cell death. The data also underscore the involvement of ER, caspases, and the proteasomal system in ER stress-induced cell death process.


Figures

Fig. 1
Fig. 1
PQ triggers ER stress and cell death in dopaminergic N27cells. (a) N27 cells were either left untreated or treated with PQ (500 µM) for 12–48 h. Cells were gently lifted and washed once with phosphate-buffered saline. Cell extracts (100 µg protein) were analyzed by Western blot analysis for GRP78, GRP94, phosphoeIF2α, eIF2α, or GADD153. The eIF2α blot was probed with antiserum specific for phospho-eIF2α. Blots were reprobed with GAPDH antiserum to assess equality of loading. Surviving versus apoptotic cells were quantified as described in the section “Experimental Methods”. Each blot is representative of four independent experiments. Positions of molecular mass markers (in kDa) are indicated at left. (b) The band density (integrated density value) is expressed graphically as a percentage ratio of densitometric optical density of the protein of interest to that of GAPDH with denotations of significance obtained from statistical analyses of pooled raw data. Data (mean ± SD) are from four independent experiments. *P < 0.05 relative to the band density of the untreated control sample. (c) N27 cells were treated with different concentrations of PQ for 48 h. Surviving versus dead cells were analyzed by MTT assay as described in the section “Experimental Methods” and results are expressed as percent of untreated surviving cells. Data (mean ± SD) are from five independent experiments performed in triplicate
Fig. 2
Fig. 2
Salubrinal protects cells against ER stress-induced apoptosis triggered by PQ. (a) N27 cells were either left untreated or exposed to PQ (500 µM) in the presence or absence of Salubrinal (20 µM). Surviving versus dead cells were analyzed by MTT assay as described in the section “Experimental Methods”, and results are expressed as percent of untreated surviving cells. Data (mean ± SD) are from four independent experiments performed in triplicate. (b) Sal treatment reduced the PQ-induced processing of caspase-7 from its zymogen (35 kDa) to active (20 kDa) form in N27 cells treated for 48 h. Blots were reprobed with GAPDH antiserum to assess equality of loading. Blot shown is representative of three independent experiments. Positions of molecular mass markers (in kDa) are indicated at left
Fig. 3
Fig. 3
PQ triggers cleavage of caspase substrates. N27 cells were treated with PQ (500 µM) for the indicated times. Cell extracts (100 µg of protein) were prepared as described in the section “Experimental Methods” and analyzed by Western blot analysis. Membranes were probed with anti-PARP antibody, rat specific anticleaved PARP antibody, or anti-p23 antibody. The PARP blot was probed with antiserum specific for cleaved PARP. Blots were reprobed with GAPDH antiserum to assess equality of loading. Each blot is representative of four independent experiments. Positions of molecular mass markers (in kDa) are indicated at left. The band density (integrated density value) is expressed graphically as a percentage ratio of densitometric optical density of cleaved PARP to that of GAPDH. Data (mean ± SD) are from four independent experiments. *P < 0.05 relative to the band density of the untreated control sample
Fig. 4
Fig. 4
p23 caspase mutant inhibits ER stress-induced cell death triggered by PQ. (a) Cell extracts were made from N27 cells either untransfected or transfected with wild-type Flag-p23 or Flag-p23D142N. Samples (150 µg protein) were incubated with 50 ng/ml active caspase-7 at 37°C for 1 h. Lane 1, cell extract isolated from cells transfected with wild-type Flag-p23, Lane 2, cell extract isolated from cells transfected with wild-type Flag-p23 and incubated with active caspase-7, Lane 3, cell extract isolated from cells transfected with Flag-p23D142N construct, Lane 4, cell extract isolated from cells transfected with Flag-p23D142N construct and incubated with active caspase-7. Cell extracts (100 µg protein) were analyzed by immunoblotting with anti-FLAG antibody to detect p23 and its cleavage product (19 kD). Blots were stripped and reprobed with GAPDH antiserum to assess equality of loading. Each blot is representative of four independent experiments. Positions of molecular mass markers (in kDa) are indicated at left. (b) Uncleavable p23 (p23D142N) inhibits ER stress-induced cell death. N27 cells were either left untransfected or transfected with 6 µg of pcDNA3, pcDNAFlag-p23, or Flag-p23D142N constructs. After 24 h, cells were either left untreated or exposed to PQ (500 µM). Surviving versus dead cells were analyzed by MTT assay as described in the section “Experimental Methods” and data normalized to untreated non-transfected control set to 100%. Data (mean ± SD) are from four independent experiments. The expression levels of the transfected constructs were monitored by immunoblot analysis (inset) of both WTp23 and p23D142N. Blots were stripped and reprobed with GAPDH antiserum to assess equality of loading. Positions of molecular mass markers (in kDa) are indicated at left
Fig. 5
Fig. 5
Requirement of downstream caspases in ER stress-induced cell death triggered by PQ. (a) N27 cells were treated with PQ (500 µM) for the indicated times. Cell extracts were prepared as described in the section “Experimental Methods” and analyzed by Western blot analysis. Membranes were probed with anti-caspase-3 antibody or anti-caspase-7 antibody. Blots were stripped and reprobed with GAPDH antiserum to assess equality of loading. Each blot is representative of four independent experiments. Positions of molecular mass markers (in kDa) are indicated at left. (b) N27 cells were treated with PQ (500 µM) for 48 h in the presence or absence of the cell-permeable caspase specific inhibitor Q-VD-OPH (25 µM). Cell extracts (50 µg protein) from untreated or PQ-treated cells were incubated with 100 µM benzyloxycarbonyl-Asp-Glu-Val-Asp-7-amino-4-trifluoromethylcoumarin (Z-DEVD-AFC) peptide substrate. Caspase activity was determined by measuring the release of amino-4-trifluoromethylcoumarin from the synthetic substrate using continuous recording instruments as described in the section “Experimental Methods”. Caspase activity was expressed as percent of control DEVDase activity per mg protein. Data (mean ± SD) are from four independent experiments performed in triplicate. *P < 0.01 relative to the activity of the PQ treated sample. (c) N27 cells were either left untreated or exposed to PQ (500 µM) in the presence or absence of the cell-permeable caspase specific inhibitor Q-VD-OPH (25 µM). Surviving versus dead cells were analyzed by MTT assay as described in the section “Experimental Methods” and results are expressed as percent of untreated surviving cells. Data (mean ± SD) are from four independent experiments performed in triplicate. *P < 0.05 relative to PQ treated sample
Fig. 6
Fig. 6
PQ inhibits 20S proteasomal activity. N27 cells were treated with PQ (500 µM) for 48 h. Cell extracts (25 µg protein) from untreated or PQ-treated cells were incubated with 10 µM of the fluorophore LLVY-AMC. 20S proteasomal activity was determined by measuring the release of 7-amino-4-methylcoumarin (AMC) following cleavage of the labeled substrate. Fluorescence was measured in a Spectramax plate reader at excitation and emission wavelengths of 380 and 460 nm, respectively. Proteasomal activity was expressed as percent of relative fluorescence units of AMC from untreated cells (RFU units) per mg protein. Data (mean ± SD) are from four independent experiments performed in triplicate. *P < 0.01 relative to untreated control sample. Cell extracts (100 µg protein) were analyzed by immunoblotting with anti-ubiquitin antibody. Blots were reprobed with GAPDH antiserum to assess equality of loading. Each blot is representative of three independent experiments. Positions of molecular mass markers (in kDa) are indicated at left. The band density (integrated density value) is expressed graphically as a percentage ratio of densitometric optical density of the ubiquitinated proteins to that of GAPDH. Data (mean ± SD) are from three independent experiments. *P < 0.01 relative to the band density of the untreated sample

Similar articles

Cited by

References

    1. Adams FS, La Rosa FG, Kumar S, Edwards-Prasad J, Kentroti S, Vernadakis A, et al. Characterization and transplantation of two neuronal cell lines with dopaminergic properties. Neurochemical Research. 1996;21:619–627. doi: 10.1007/BF02527762. - DOI - PubMed
    1. Andersen JK. What causes the build-up of ubiquitin-containing inclusions in Parkinson’s disease? Mechanisms of Ageing and Development. 2000;118:15–22. doi: 10.1016/S0047-6374 (00)00150-0. - DOI - PubMed
    1. Andersen JK. Paraquat and iron exposure as possible synergistic environmental risk factors in Parkinson’s disease. Neurotoxic Research. 2003;5:307–313. - PubMed
    1. Andersen JK. Oxidative stress in neurodegeneration: Cause or consequence? Nature Medicine. 2004;10 Suppl:S18–S25. doi: 10.1038/nrn1434. - DOI - PubMed
    1. Bose S, Weikl T, Bugl H, Buchner J. Chaperone function of Hsp90-associated proteins. Science. 1996;274:1715–1717. doi: 10.1126/science.274.5293.1715. - DOI - PubMed

Publication types

MeSH terms