

Review
doi: 10.1016/j.vaccine.2008.04.012.
Virulence evolution in response to vaccination: the case of malaria
Affiliations
- PMID: 18773536
- PMCID: PMC2663389
- DOI: 10.1016/j.vaccine.2008.04.012
Item in Clipboard
Review
Virulence evolution in response to vaccination: the case of malaria
Vaccine.
.
Abstract
One theory of why some pathogens are virulent (i.e., they damage their host) is that they need to extract resources from their host in order to compete for transmission to new hosts, and this resource extraction can damage the host. Here we describe our studies in malaria that test and support this idea. We go on to show that host immunity can exacerbate selection for virulence and therefore that vaccines that reduce pathogen replication may select for more virulent pathogens, eroding the benefits of vaccination and putting the unvaccinated at greater risk. We suggest that in disease contexts where wild-type parasites can be transmitted through vaccinated hosts, evolutionary outcomes need to be considered.
Figures
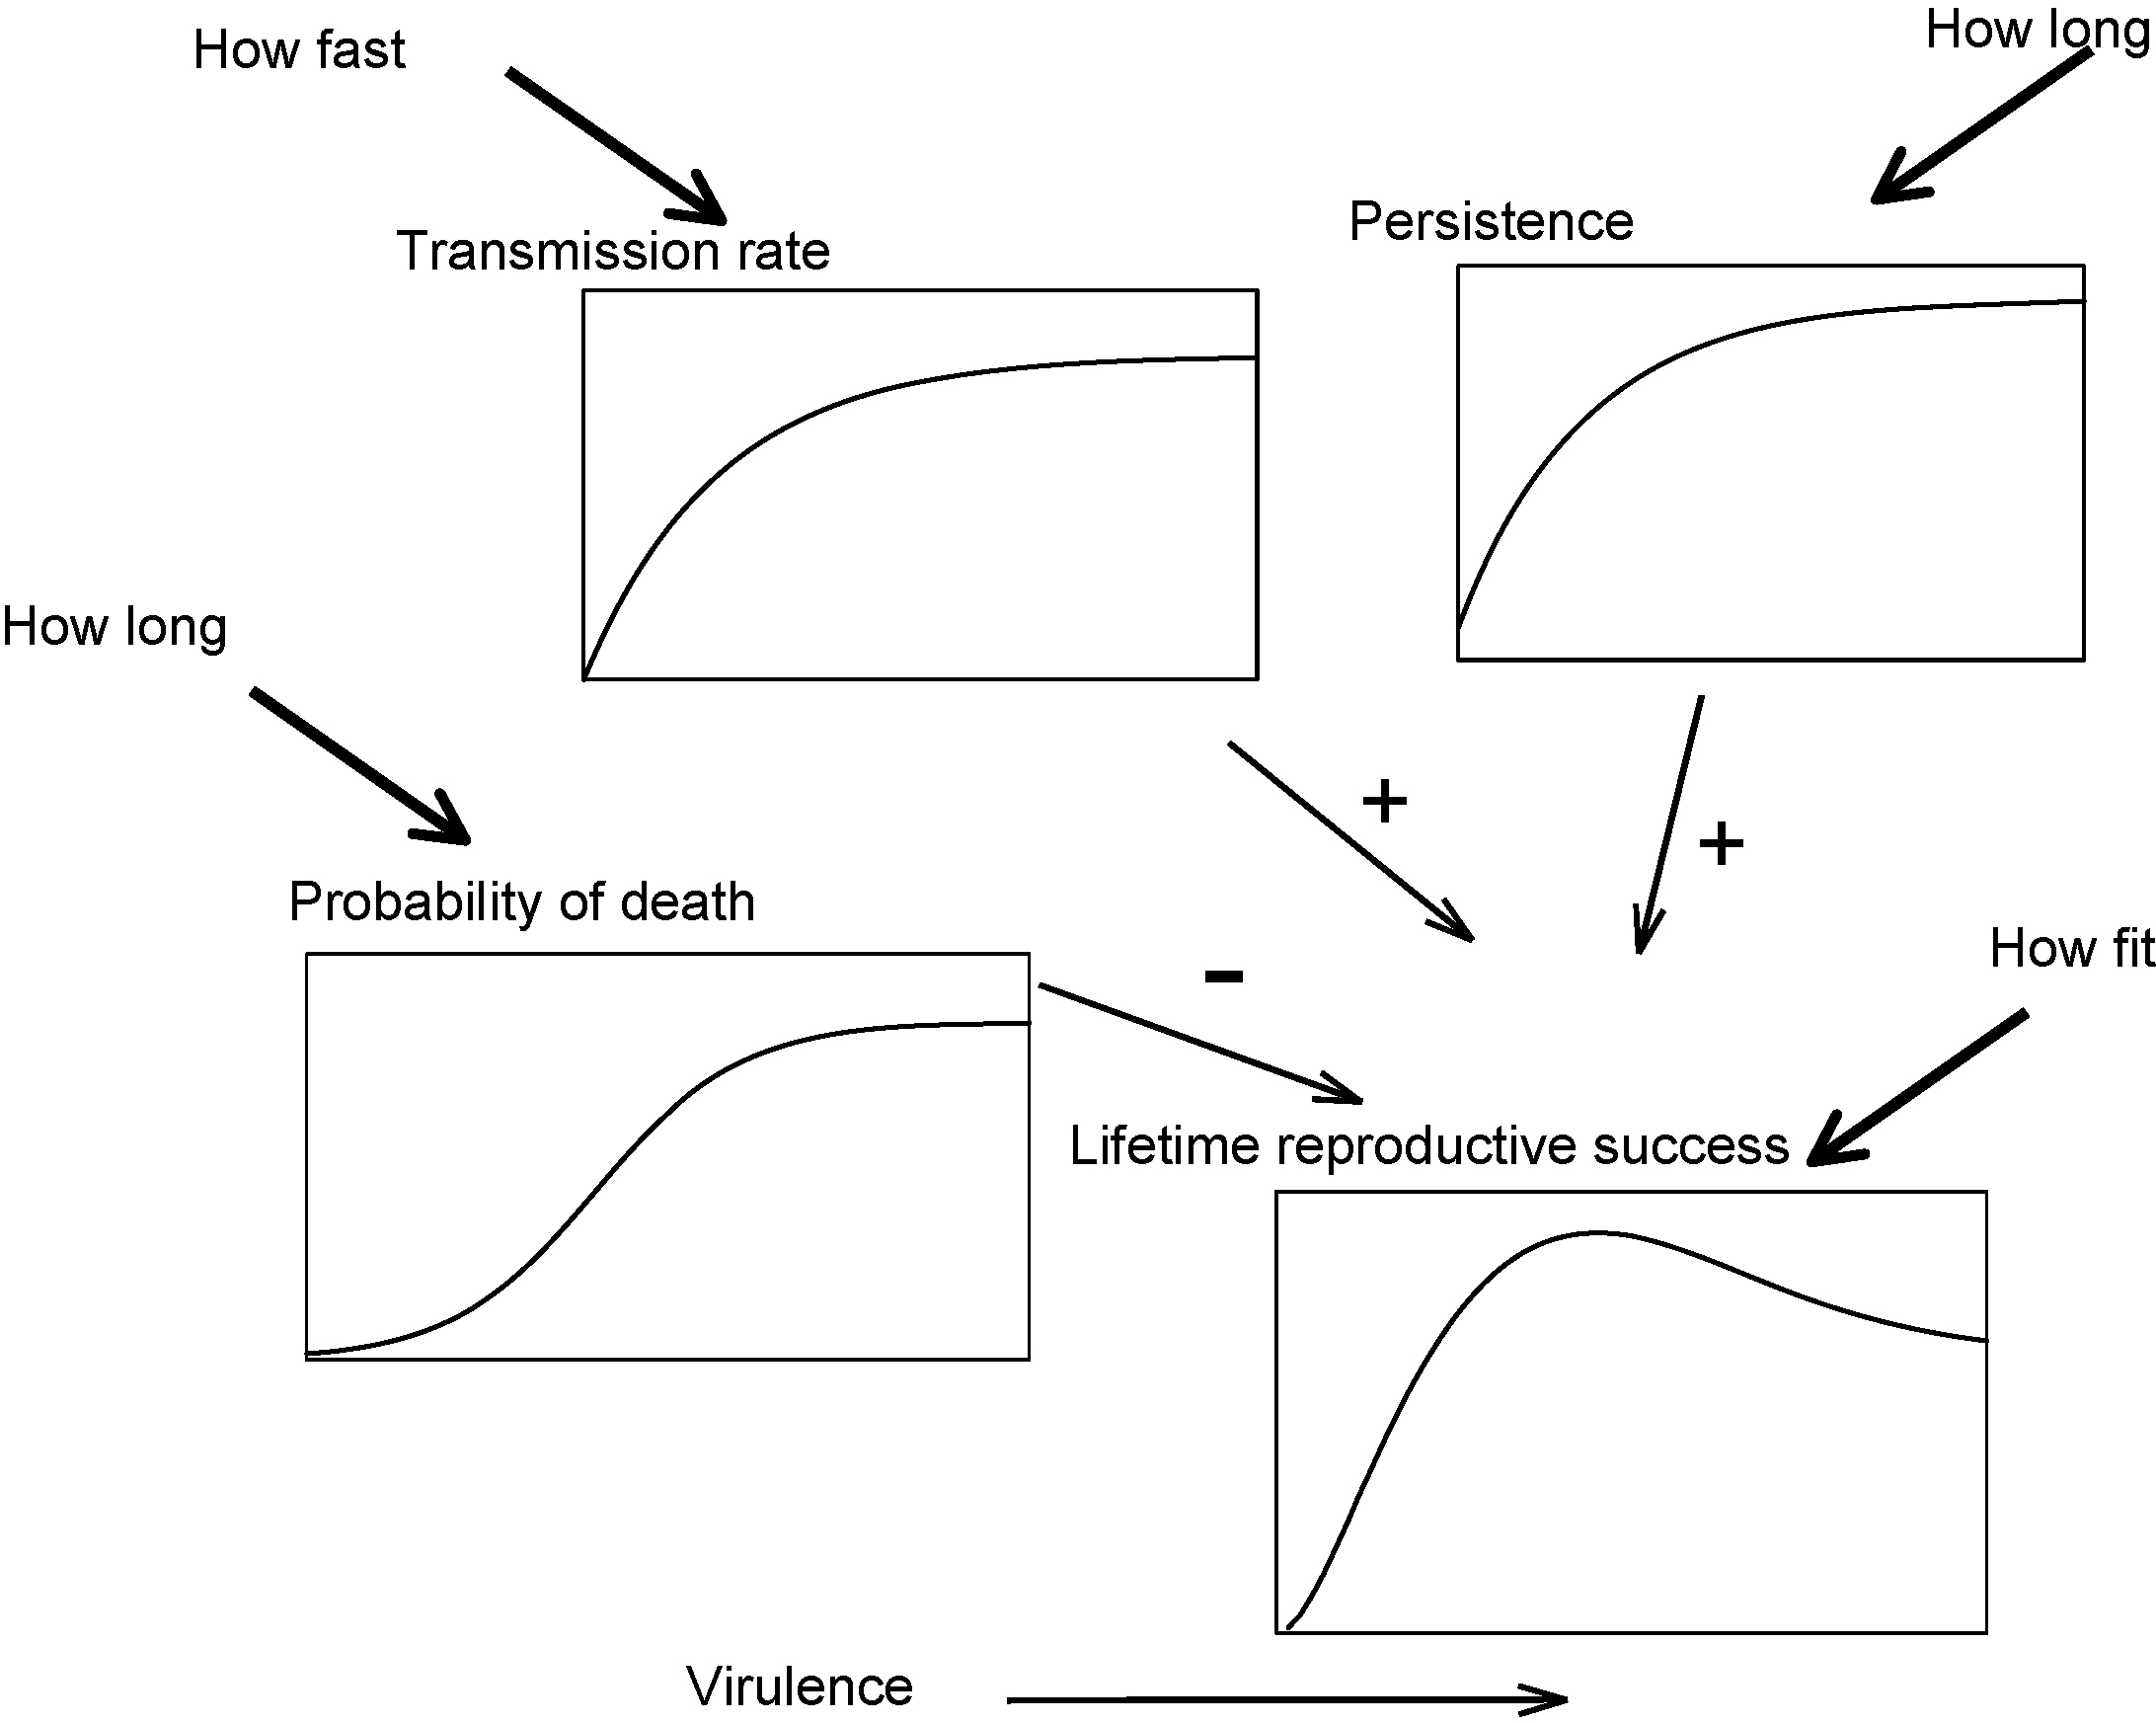
The costs and benefits of virulence (or, alternatively, high levels of host exploitation) to pathogen fitness. The fitness benefits associated with virulence are higher transmissibility and persistence (duration of infection). The fitness cost of virulence is host mortality which shortens the infection. The rate of transmission and length of infection (which is determined by both persistence and the probability that the host dies) multiply together to give the total lifetime transmission of the pathogen from the host, i.e., its fitness. This reaches a maximum at an intermediate level of virulence when the negative and positive effects on virulence are combined in this way. Note that the transmissibility and duration of infection curves have to be less than linear (i.e., convex) in order to produce an intermediate optimum virulence.
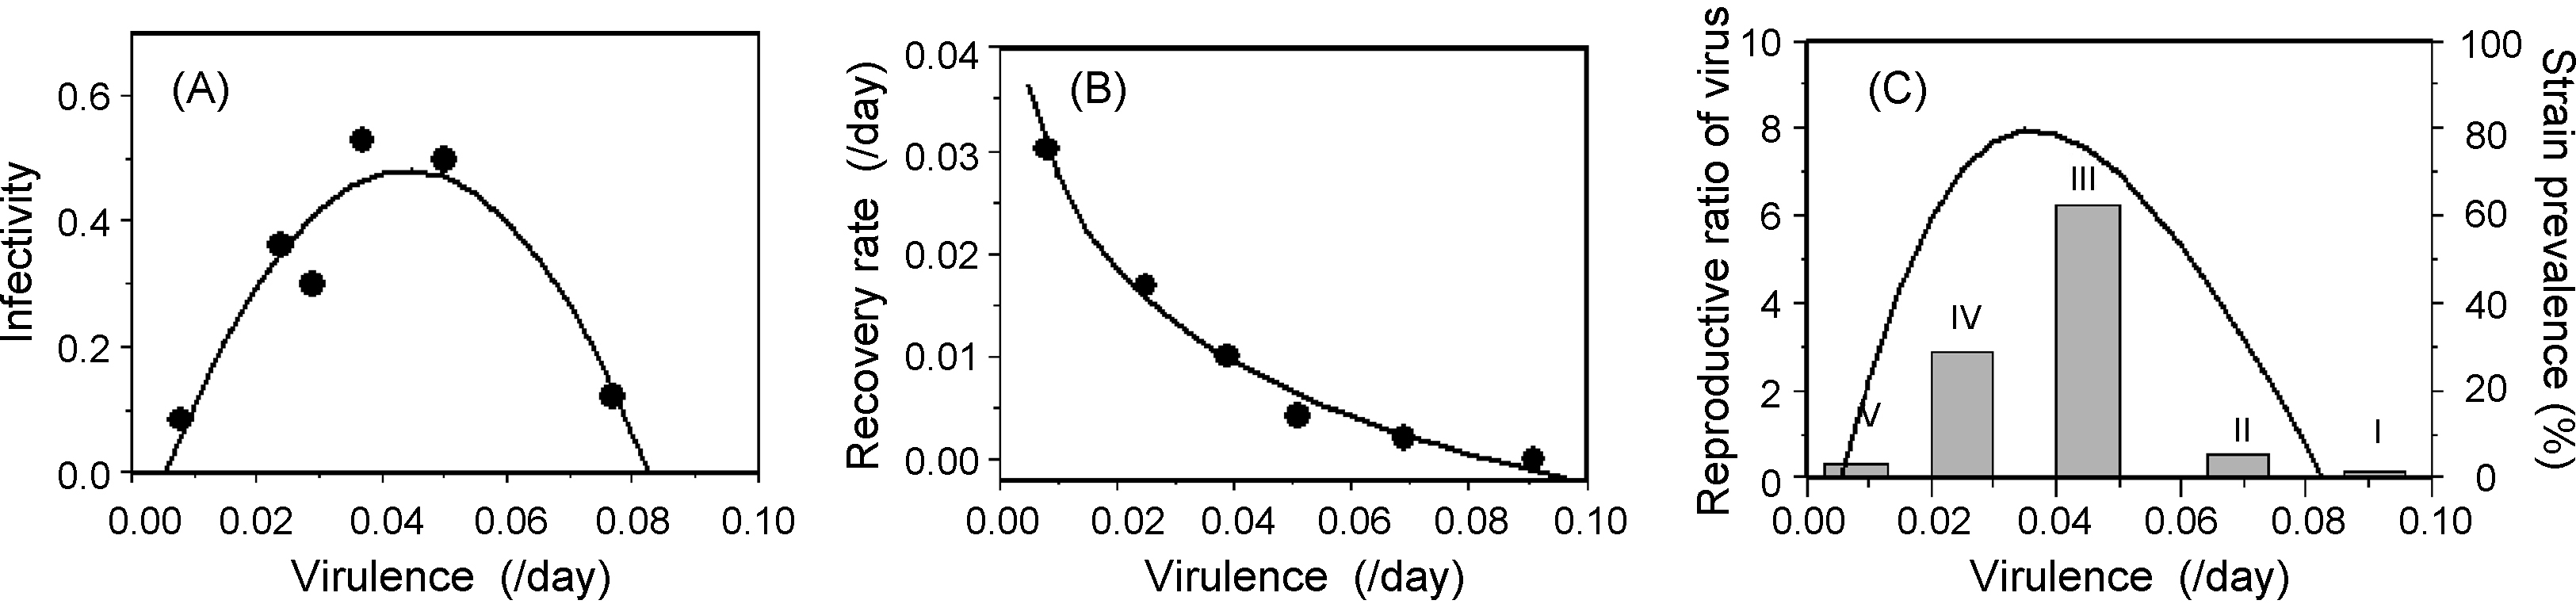
Virulence evolution in myxomatosis. A highly virulent myxomatosis virus was released into a rabbit population of Australia and Britain in the early 1950s. By the mid-1960s, strains of the virus that were less virulent than the original were found to be circulating in the populations (graded I–V in increasing order of virulence). The virulence of these strains showed positive, curvilinear relationships with infectivity to fleas/mosquitoes (panel A) and the length of infection (panel B) when measured in laboratory rabbits. Using either of these relationships, and keeping the other one constant, gives maximum fitness at an intermediate level of virulence , : this is also the case when both vary, as shown in panel C. The predicted fitness function matches the distribution of strains observed in Australia after a decade (1959–1969) where the most prevalent strains (grey bars) in the population were those of intermediate virulence, a situation which lasted for some time until the host evolved higher levels of resistance , . Note that the very low infectivity of the highly virulent strain is not necessary to generate an intermediate virulence optimum: a transmissibility–virulence curve that saturated at 60% would too. Following Anderson and May , assumed values of other parameters were a background mortality rate of 0.011/day and values of the daily transmission rate to uninfected rabbits approximately equal to infectivity, i.e., 0.1–0.6 transmissions per infected rabbit per day.
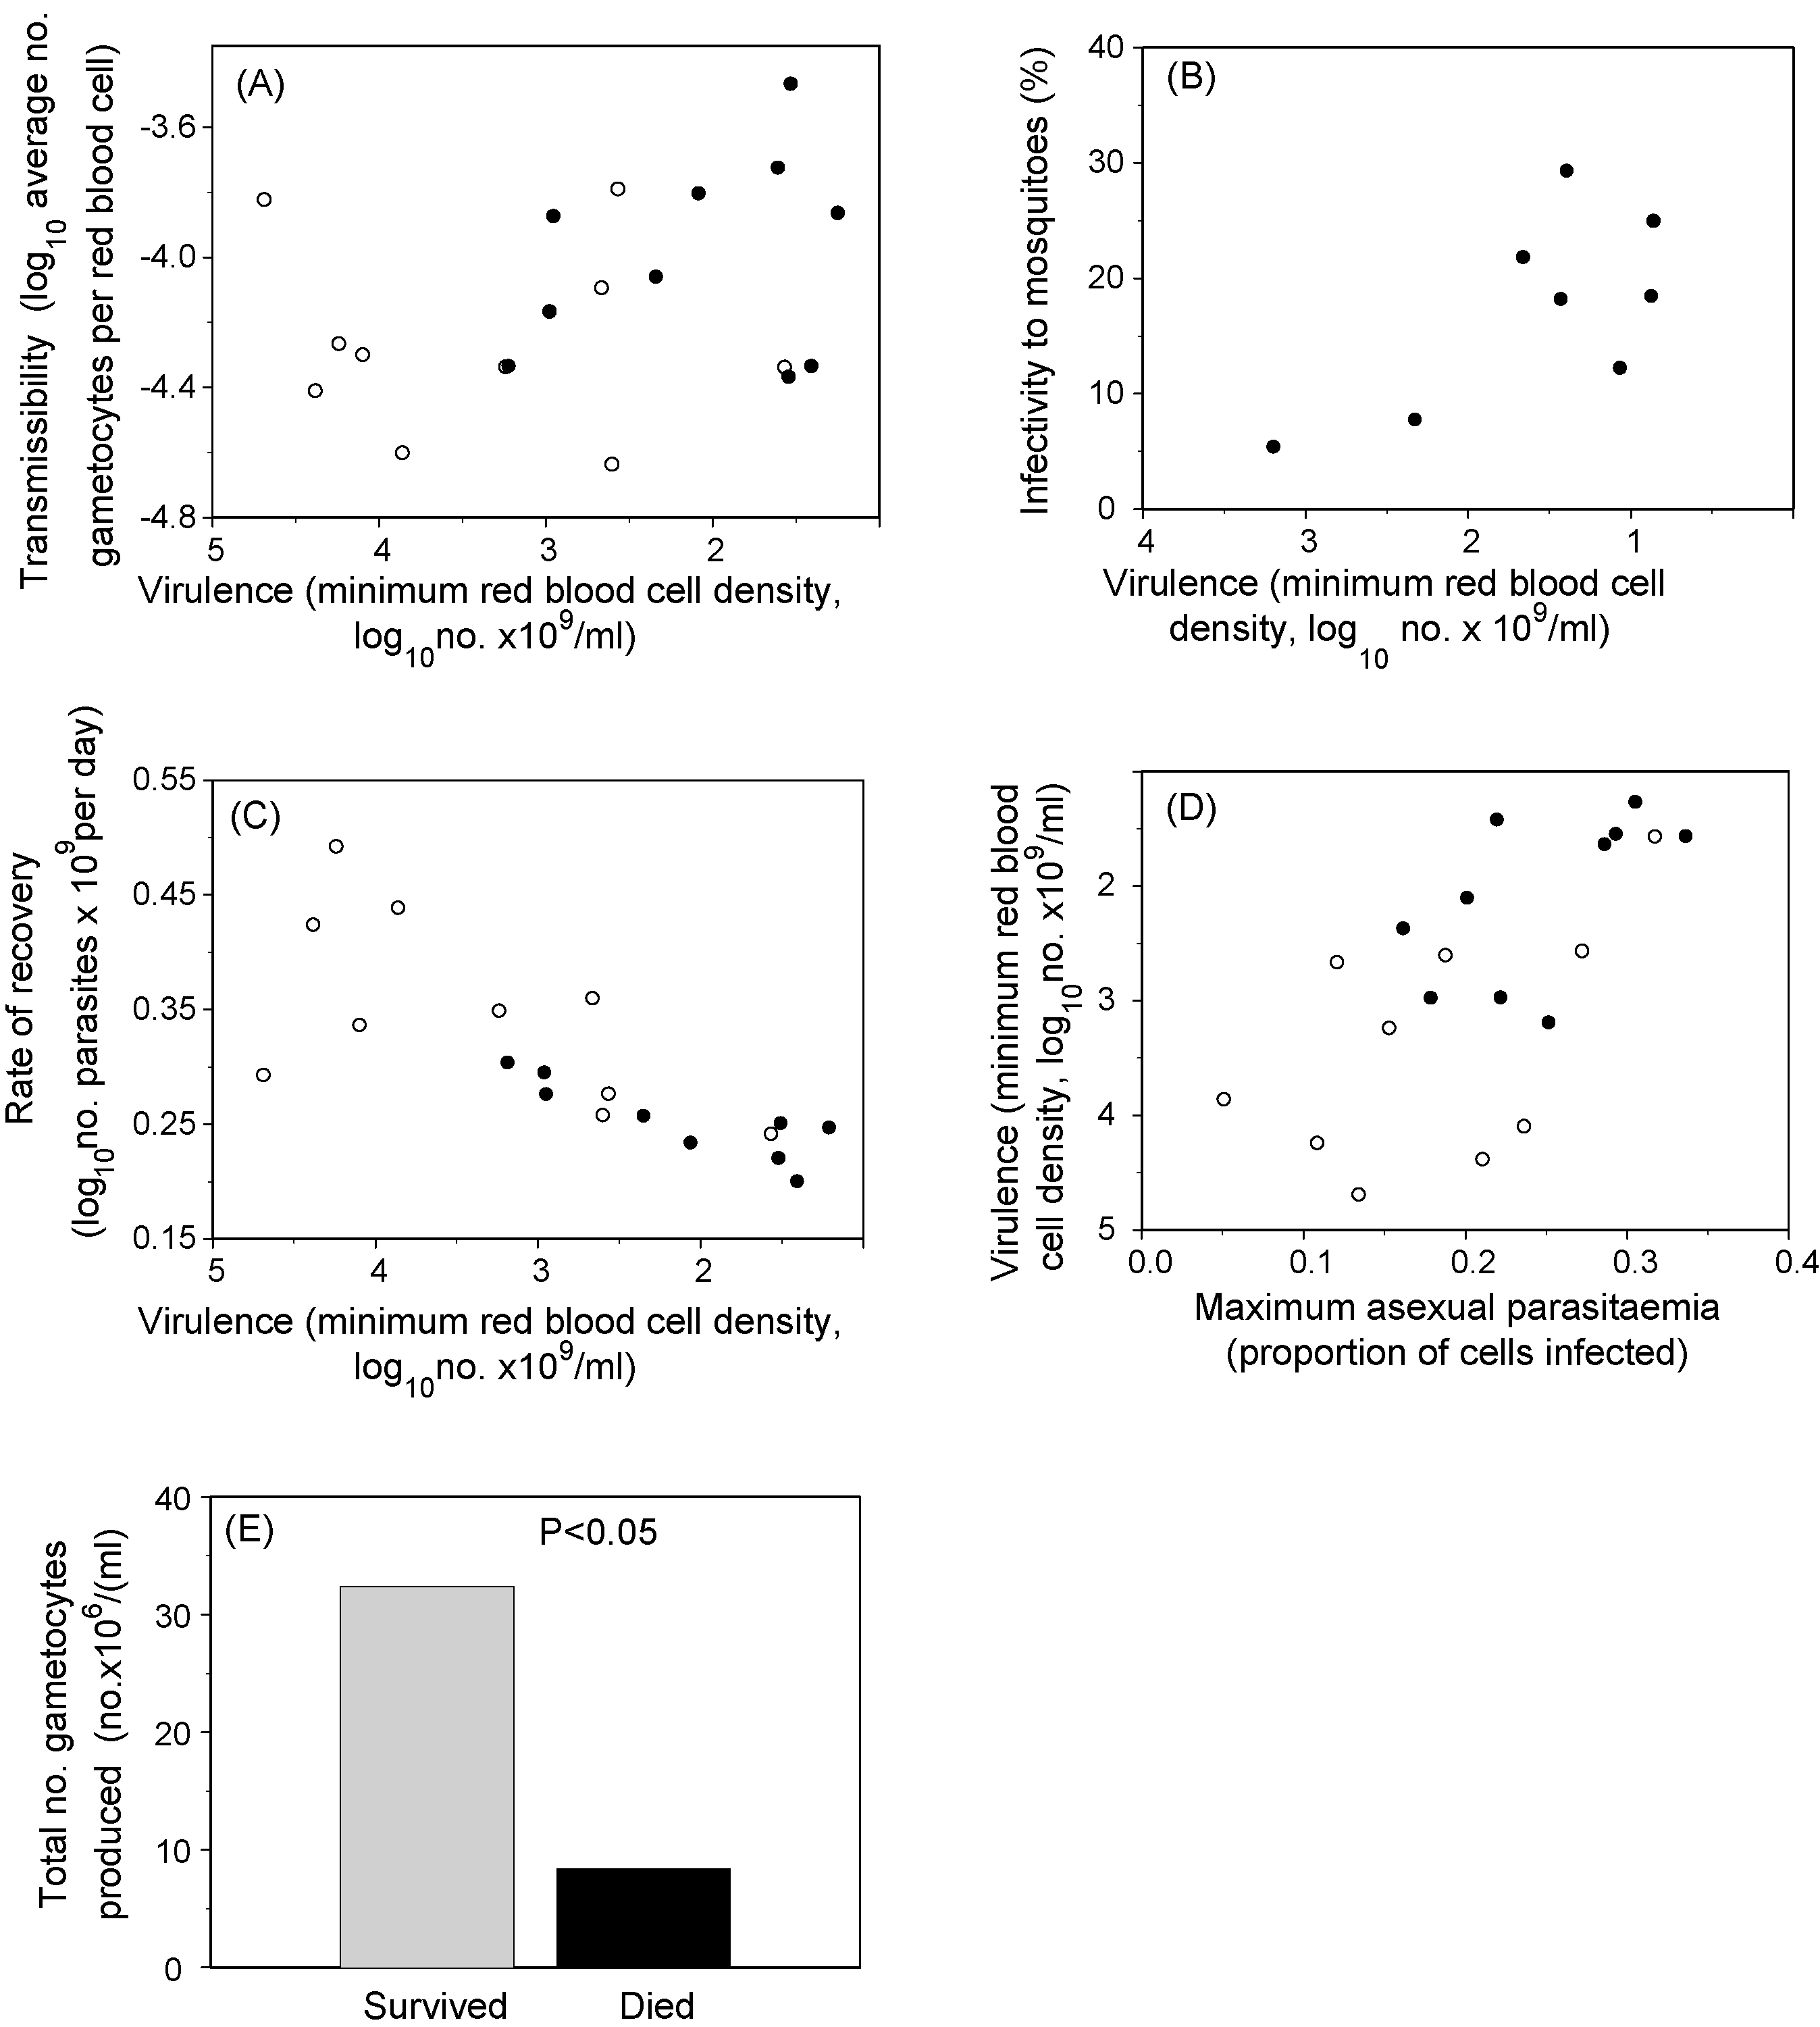
Virulence–transmissibility–persistence relationships in the mouse model of malaria, P. chabaudi. Each point is the average value of groups of mice (n = 5–10) infected with one parasite clone: thus a line fitted to the points would represent the parasite genetic relationship among the traits. Filled symbols indicate naïve mice and open symbols indicate mice made semi-immune by previous infection and drug clearance. Virulence was measured as the mouse's minimum red blood cell density reached during the infection. It was shown to positively relate to transmissibility as measured by daily average gametocyte density (panel A), and infectivity to mosquitoes on 2–4 days during the peak of gametocyte production (panel B). Recovery rate (panel C), which is inversely related to infection length, was measured as the rate at which the infection declined after peak parasitaemia and was negatively related to virulence, as expected. Virulence was positively related to maximum parasitaemia (panel D), an indicator of host exploitation. Clones broadly retained their rankings for all traits when infecting naïve vs. immunised mice (Pearson correlations across treatments of 0.59–0.66 for the four traits used here.) In the experiments described in panels A–D, very few mice died and so a virulence cost to transmission was not observable. However, in another experiment using less resistant host genotypes, mortality was high (23%) and was shown to severely reduce the total number of gametocytes produced by the infection, shown in panel E. Data were reproduced with permission from Mackinnon et al. and Mackinnon and Read .
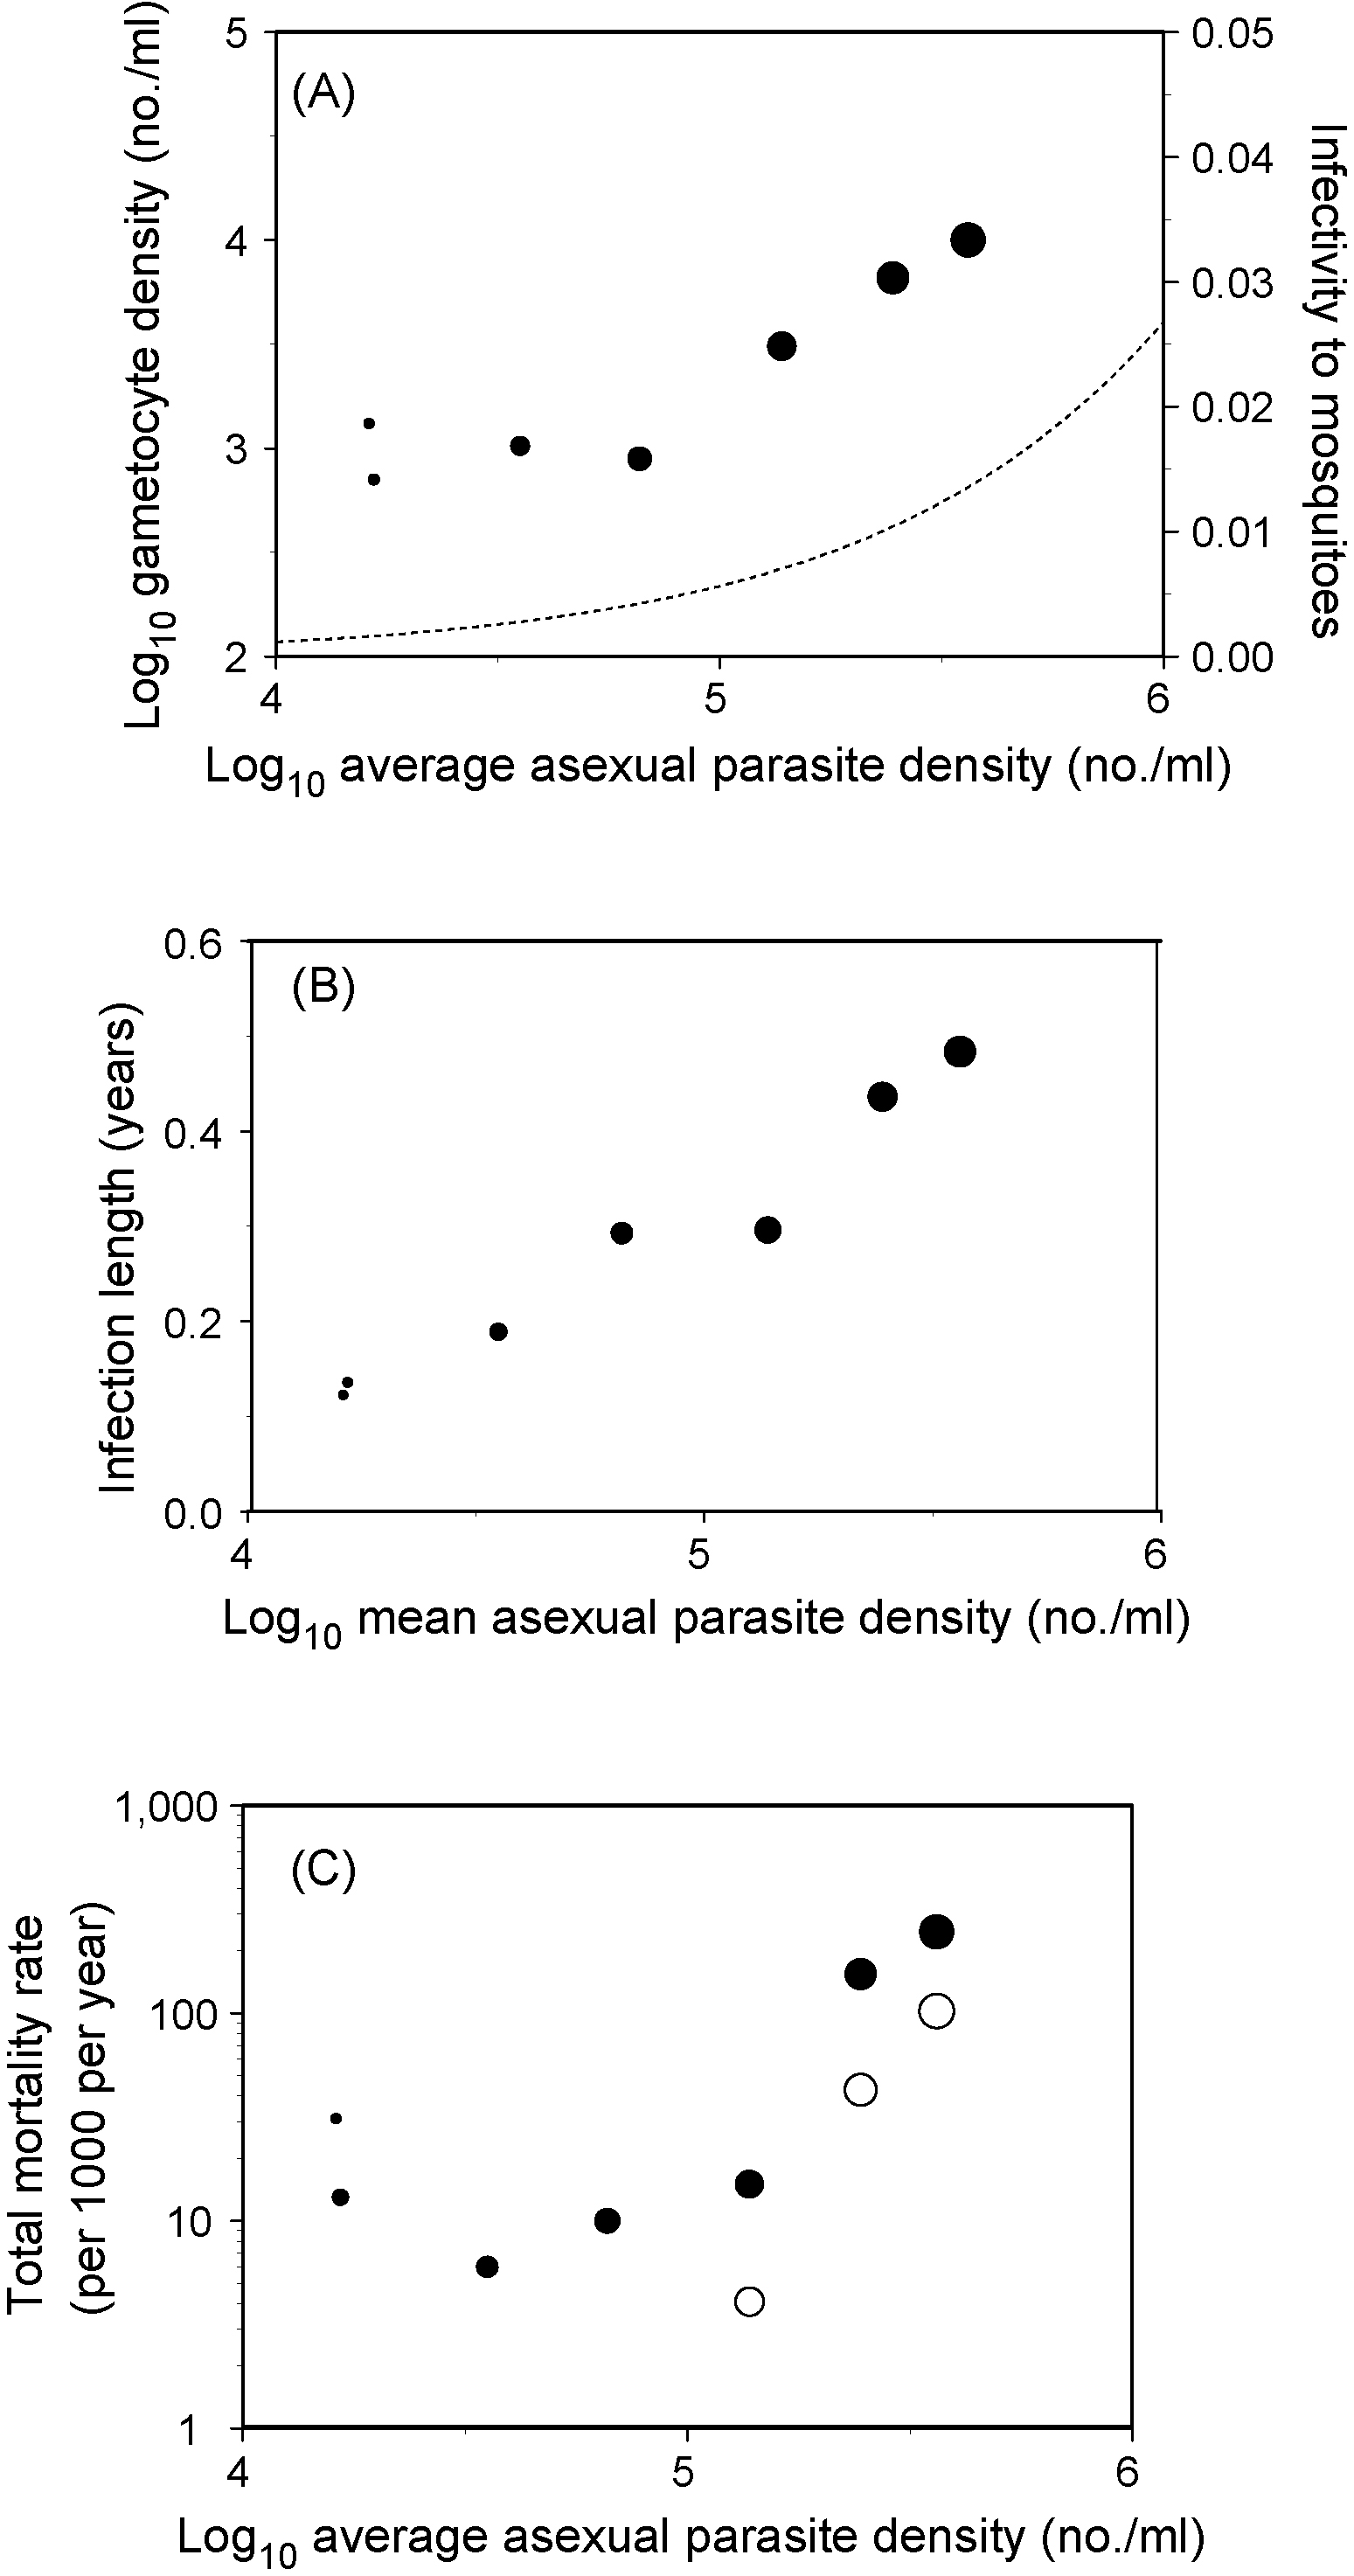
Relationships between level of host exploitation, transmissibility, persistence, and virulence (mortality) in human malaria in the field. Data were taken from a longitudinal study in Nigeria in the 1970s (the Garki project, [32]). Host exploitation is on the x-axis and is represented by average asexual parasite density. Each symbol represents an average for a group of people from the same age-group measured in eight surveys, and decreases in size with age. Transmissibility (panel A) is represented by gametocyte density, and then converted to infectivity (dotted line, right axis) using logistic regression fitted to data from experimental mosquito infectivity data from the literature (data not shown). Persistence (panel B) is represented by infection length estimated from consecutive 10-week surveys and adjusted for superinfections to lengths of individual infections using the method described by Dietz et al. . All-cause mortality rates (panel C) are shown as closed symbols: these are due to other factors as well as malaria, and include all the malaria infections that occur in a host per year, i.e., including superinfections. The open symbols represent the values of mortality assuming that 25% of all deaths under the age of 9 years, and 1% in older categories, are due to malaria: these values are representative of studies where these proportions have been estimated, albeit with considerable uncertainty .
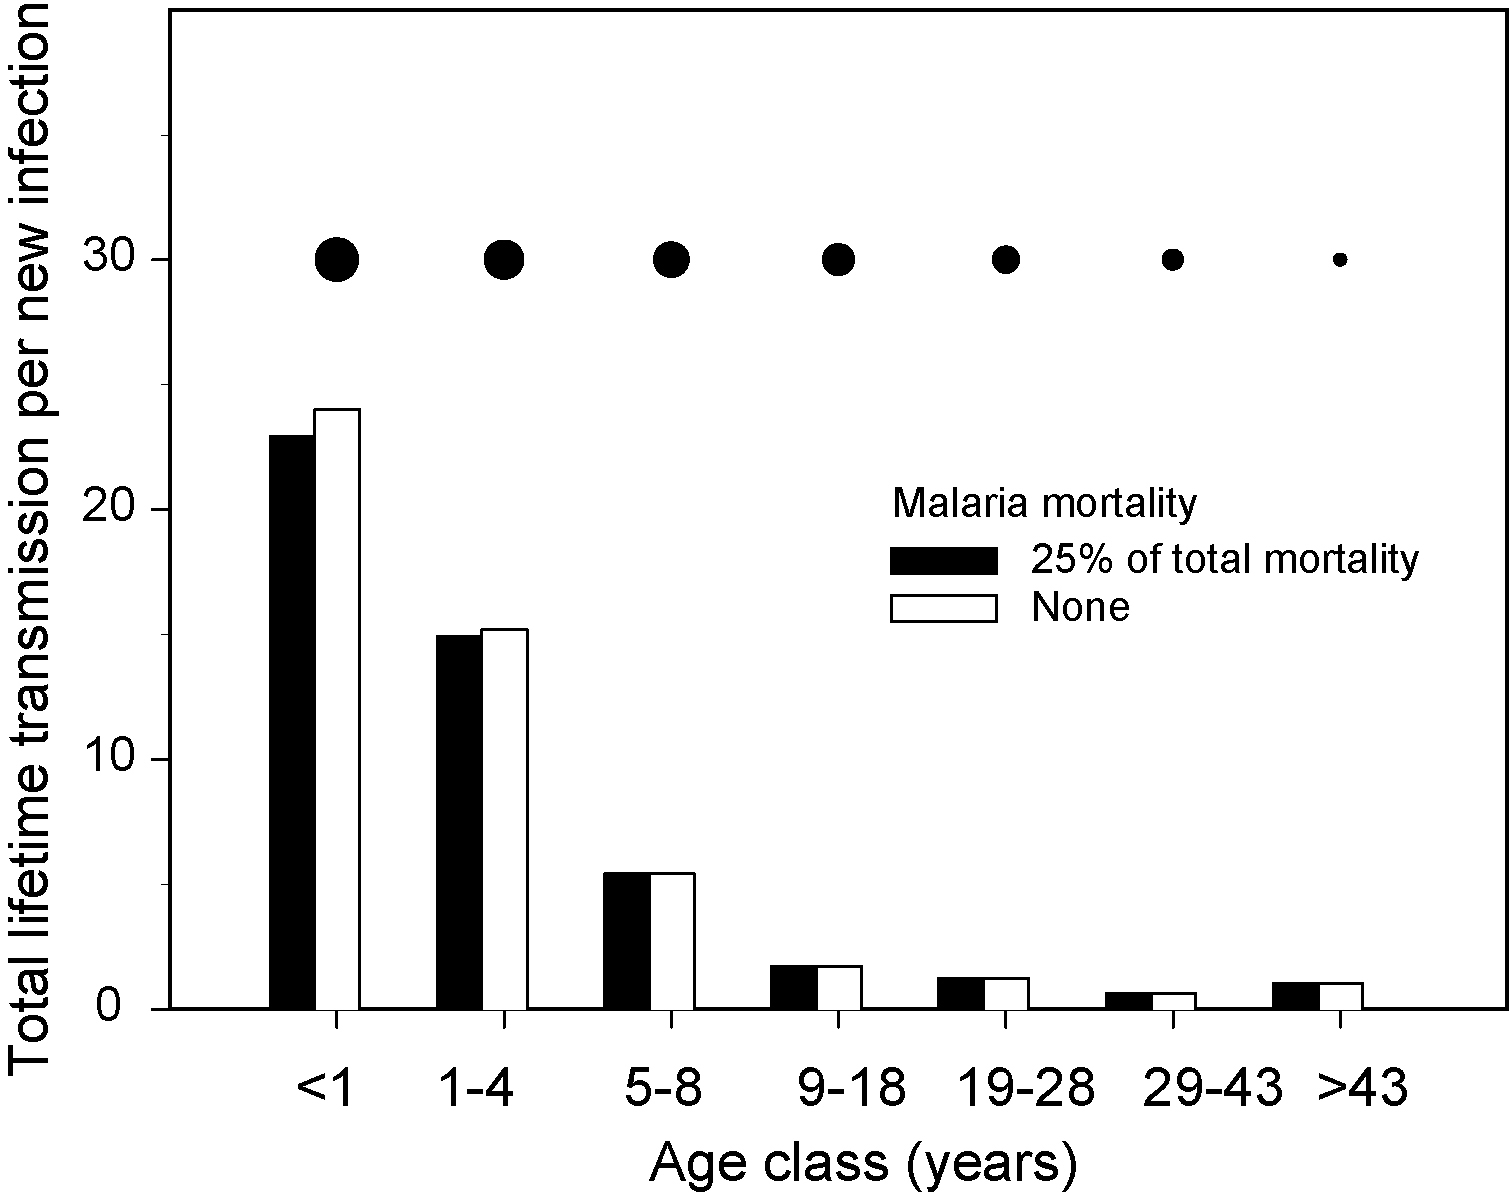
The expected amount of total transmission from hosts in different age-classes in the Garki project based on the data shown in Fig. 4 gives some indication of the parasite's relative fitness in different host types. Total transmission (black bars) was calculated as infectivity multiplied by vectorial capacity (the expected number of infectious bites to new hosts that result from a mosquito feeding on one host, infected or not, assumed to have a value of 8 here) divided by the expected infection length. Infection length here is the reciprocal of all-cause mortality rate (Fig. 4c) plus recovery rate (the inverse of individual infection length, Fig. 4b). We use the length of an individual parasite infection in this calculation because we are interested in the relative transmission, or fitness, of an individual parasite strain rather than the total transmission from a group of coinfecting strains occupying the same host. By contrast, mortality rate in this calculation is all-cause mortality because individual parasite genotypes suffer from the mortality caused by coinfecting parasites as well as that caused by themselves. To illustrate the cost of host death on the parasite's total lifetime productivity, we have performed the same calculation as above but assuming that none of the all-cause mortality is due to malaria (see Fig. 4 legend) (white bars). The different-sized symbols above the bars correspond to those for the different age-classes in Fig. 4.
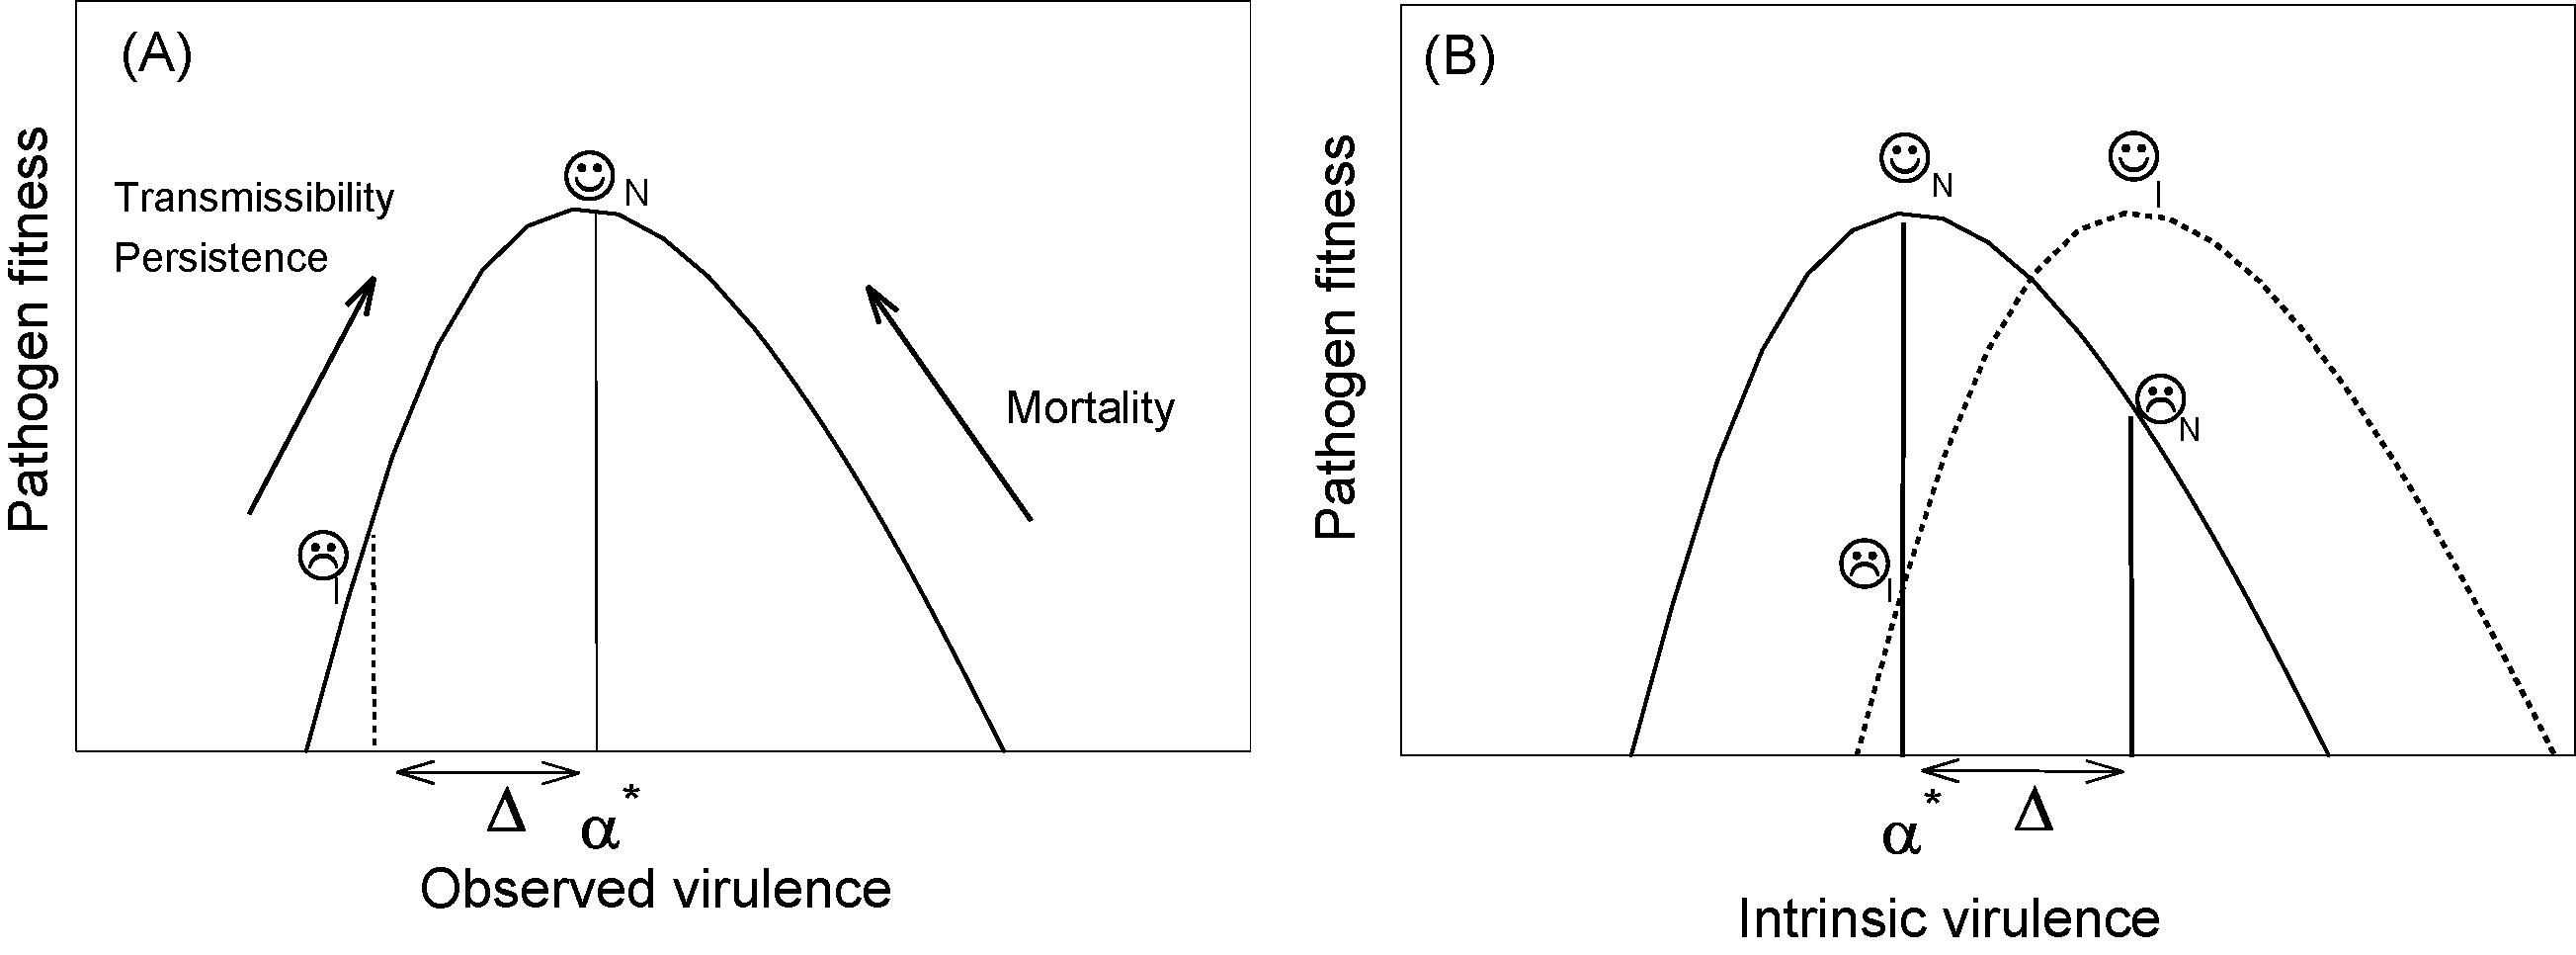
Immunity selects for higher levels of intrinsic virulence. In panel A, the solid line shows the fitness curve for parasites as a function of observed (or realised) virulence in naïve hosts. In naïve hosts, it is maximised at some intermediate virulence level, α*, as indicated by the  symbol. However, if the parasite finds itself in a semi-immune host, its fitness is lower than maximal (vertical dotted line) because of its lower (by amount Δ) or observed virulence, hence the
  symbol. In panel B, the fitness is shown as a function of intrinsic virulence, i.e., that which would be observed in naïve hosts. In naïve hosts (solid line), α* is the optimal level of virulence, as in panel A. However, in semi-immune hosts (dotted line), the optimal level of intrinsic virulence fitness would be maximised at a higher level of virulence, viz. α* + Δ. This is because its realised virulence would be this value, less the effect of immunity, Δ. But this optimal level of intrinsic virulence at α* + Δ would be too high for a naïve host (solid line), as indicated by the symbol.
symbol. However, if the parasite finds itself in a semi-immune host, its fitness is lower than maximal (vertical dotted line) because of its lower (by amount Δ) or observed virulence, hence the symbol. In panel B, the fitness is shown as a function of intrinsic virulence, i.e., that which would be observed in naïve hosts. In naïve hosts (solid line), α* is the optimal level of virulence, as in panel A. However, in semi-immune hosts (dotted line), the optimal level of intrinsic virulence fitness would be maximised at a higher level of virulence, viz. α* + Δ. This is because its realised virulence would be this value, less the effect of immunity, Δ. But this optimal level of intrinsic virulence at α* + Δ would be too high for a naïve host (solid line), as indicated by the symbol.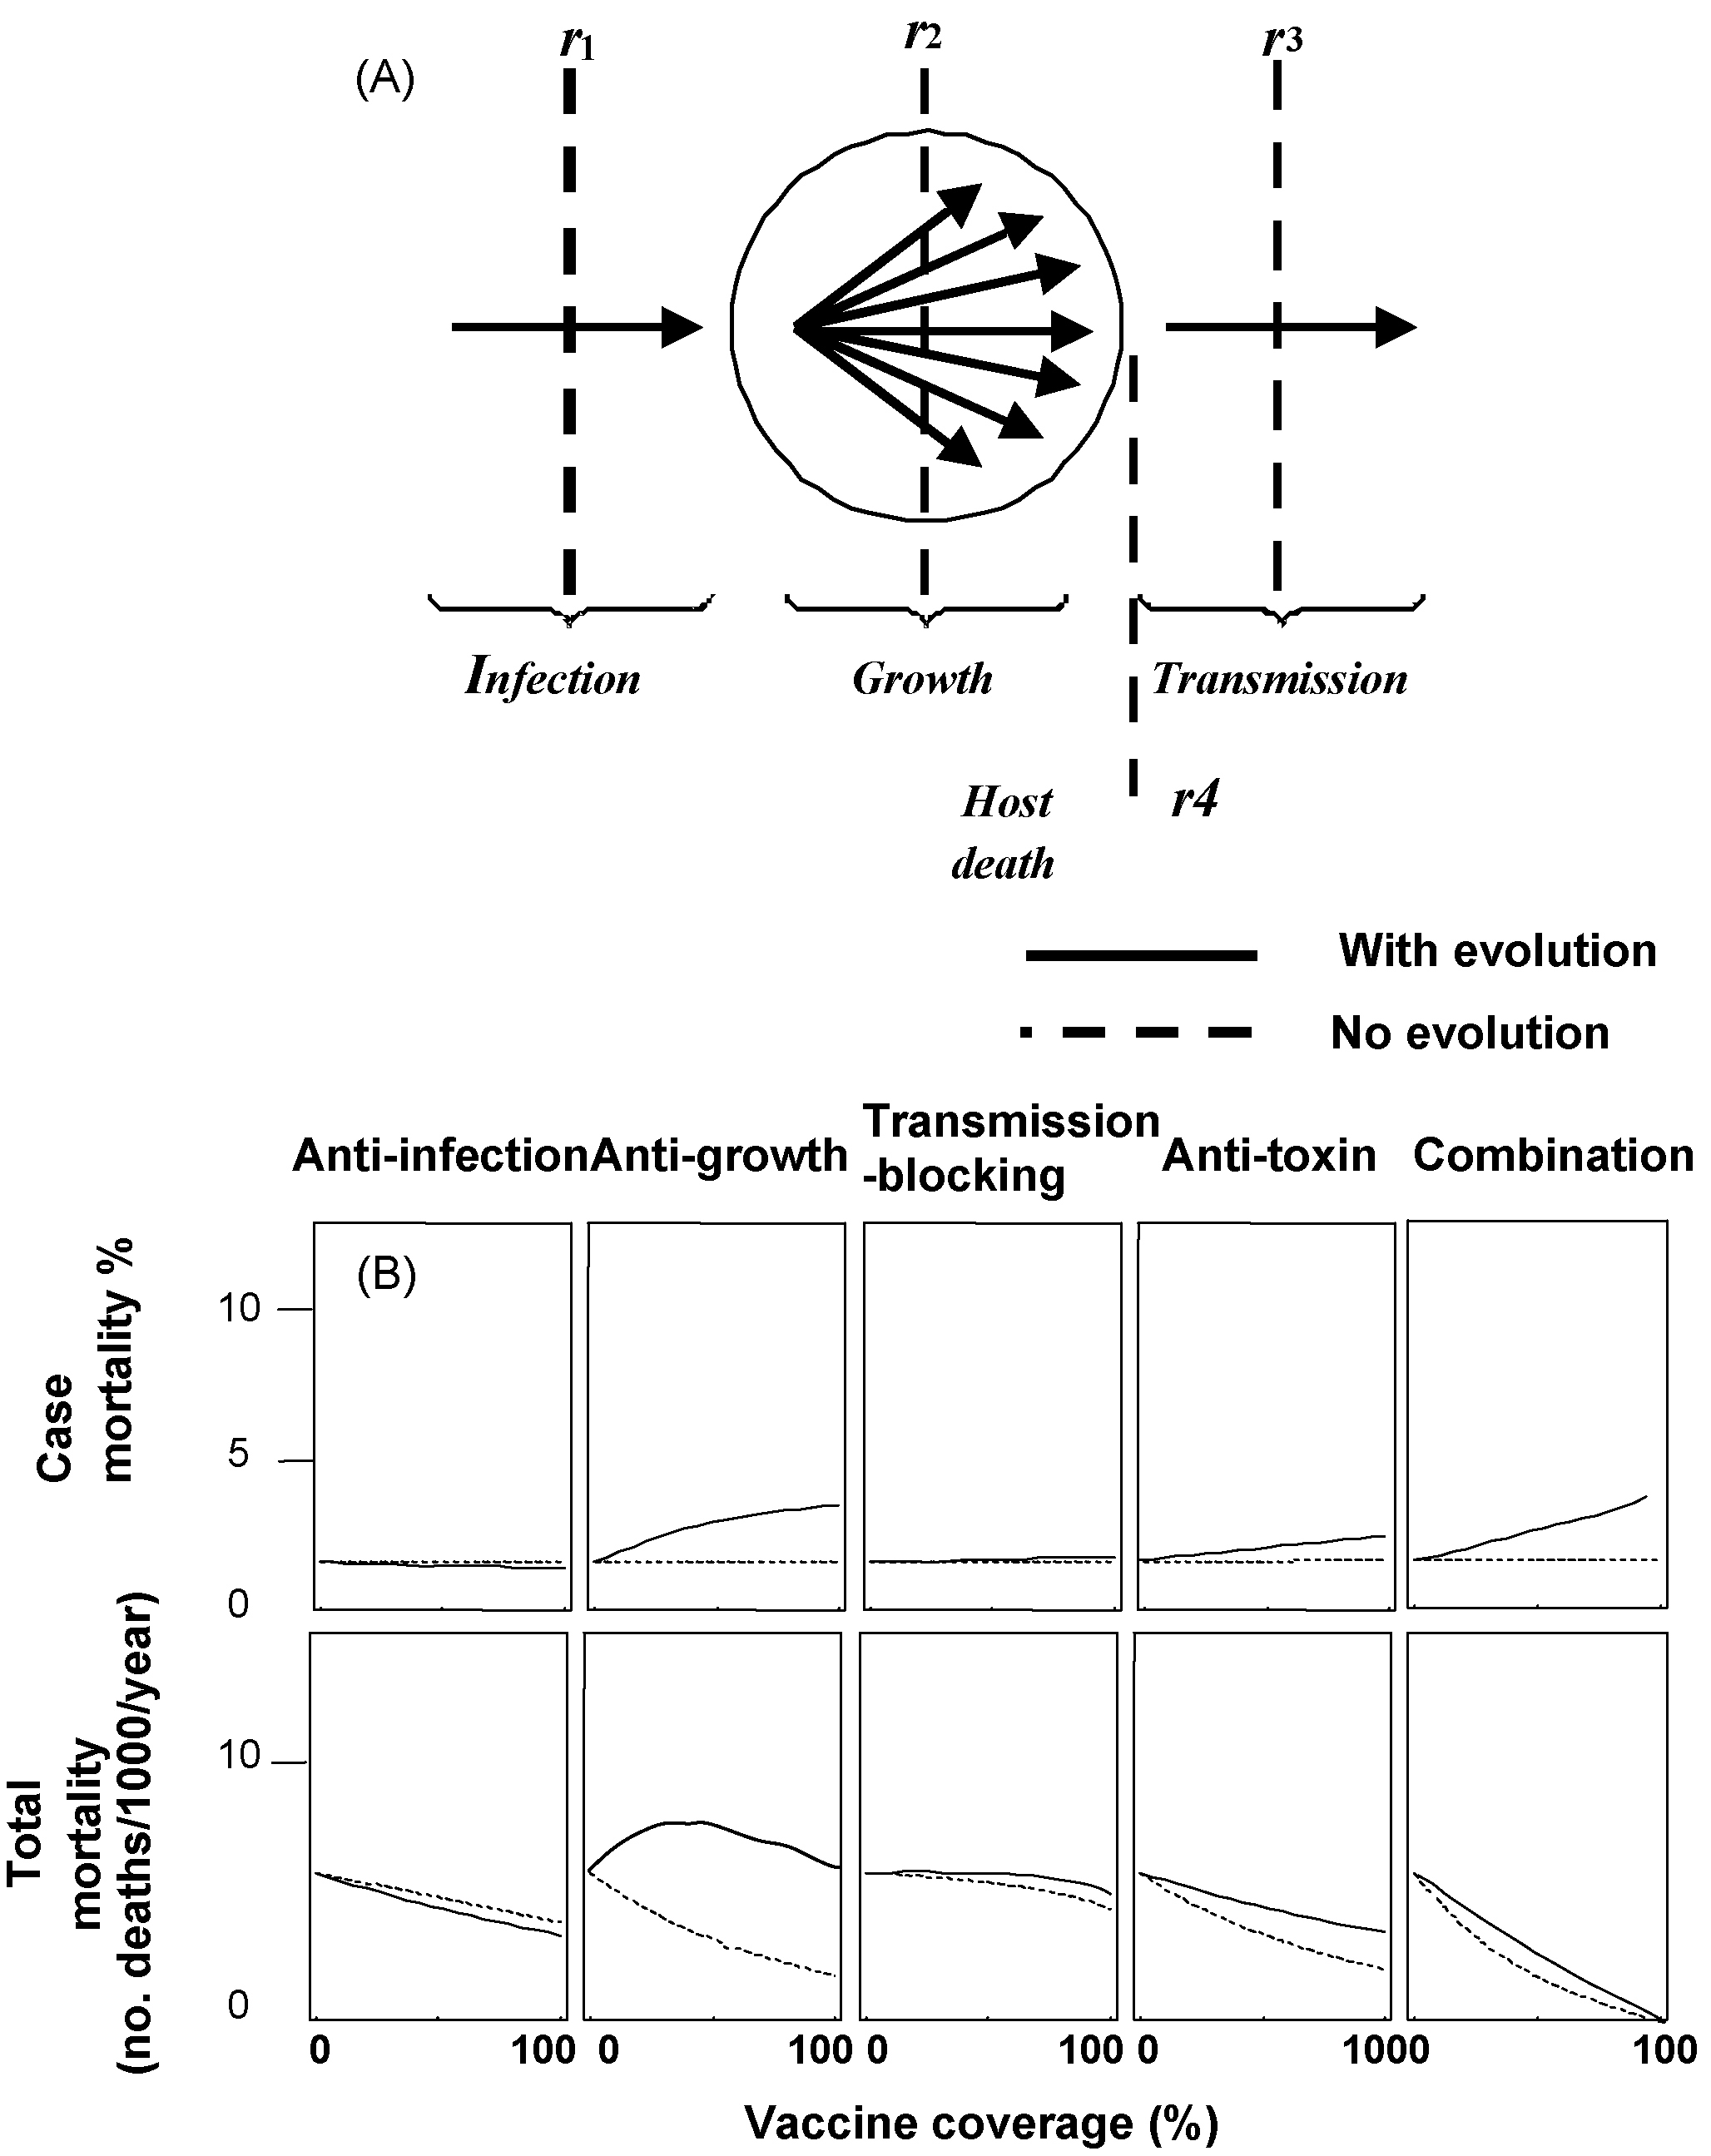
Vaccines (or other control devices) can be targeted at different stages of the malaria parasite's life cycle (panel A). r1-type devices block infection (e.g., a liver-stage vaccine), r2-type devices act against replication (e.g., asexual-stage vaccines), r3-type devices act against transmission from the host (e.g., transmission-blocking vaccines or bednets), and r4-type devices act directly against the toxicity of the pathogen (e.g., anti-toxin vaccine, or life-saving therapies). The consequences of virulence evolution to unvaccinated hosts (top panel) and the total population of hosts (vaccinated, unvaccinated and naturally immune) are shown as a function of vaccine coverage (x-axis) (panel B). The solid lines show the mortality expected if the pathogen evolves, and the dotted lines show the consequences if it does not. For an r2-type vaccine, virulence evolution is expected to erode all the benefits of vaccination and cause more death in unvaccinated individuals. In contrast, r1-type and r3-type devices are expected to select for avirulence. Preventing death using an r4-type device selects for higher virulence in unvaccinated people, but is beneficial to the overall population. The effect of a combination vaccine is shown in the last column. Reproduced with permission from Gandon et al. .
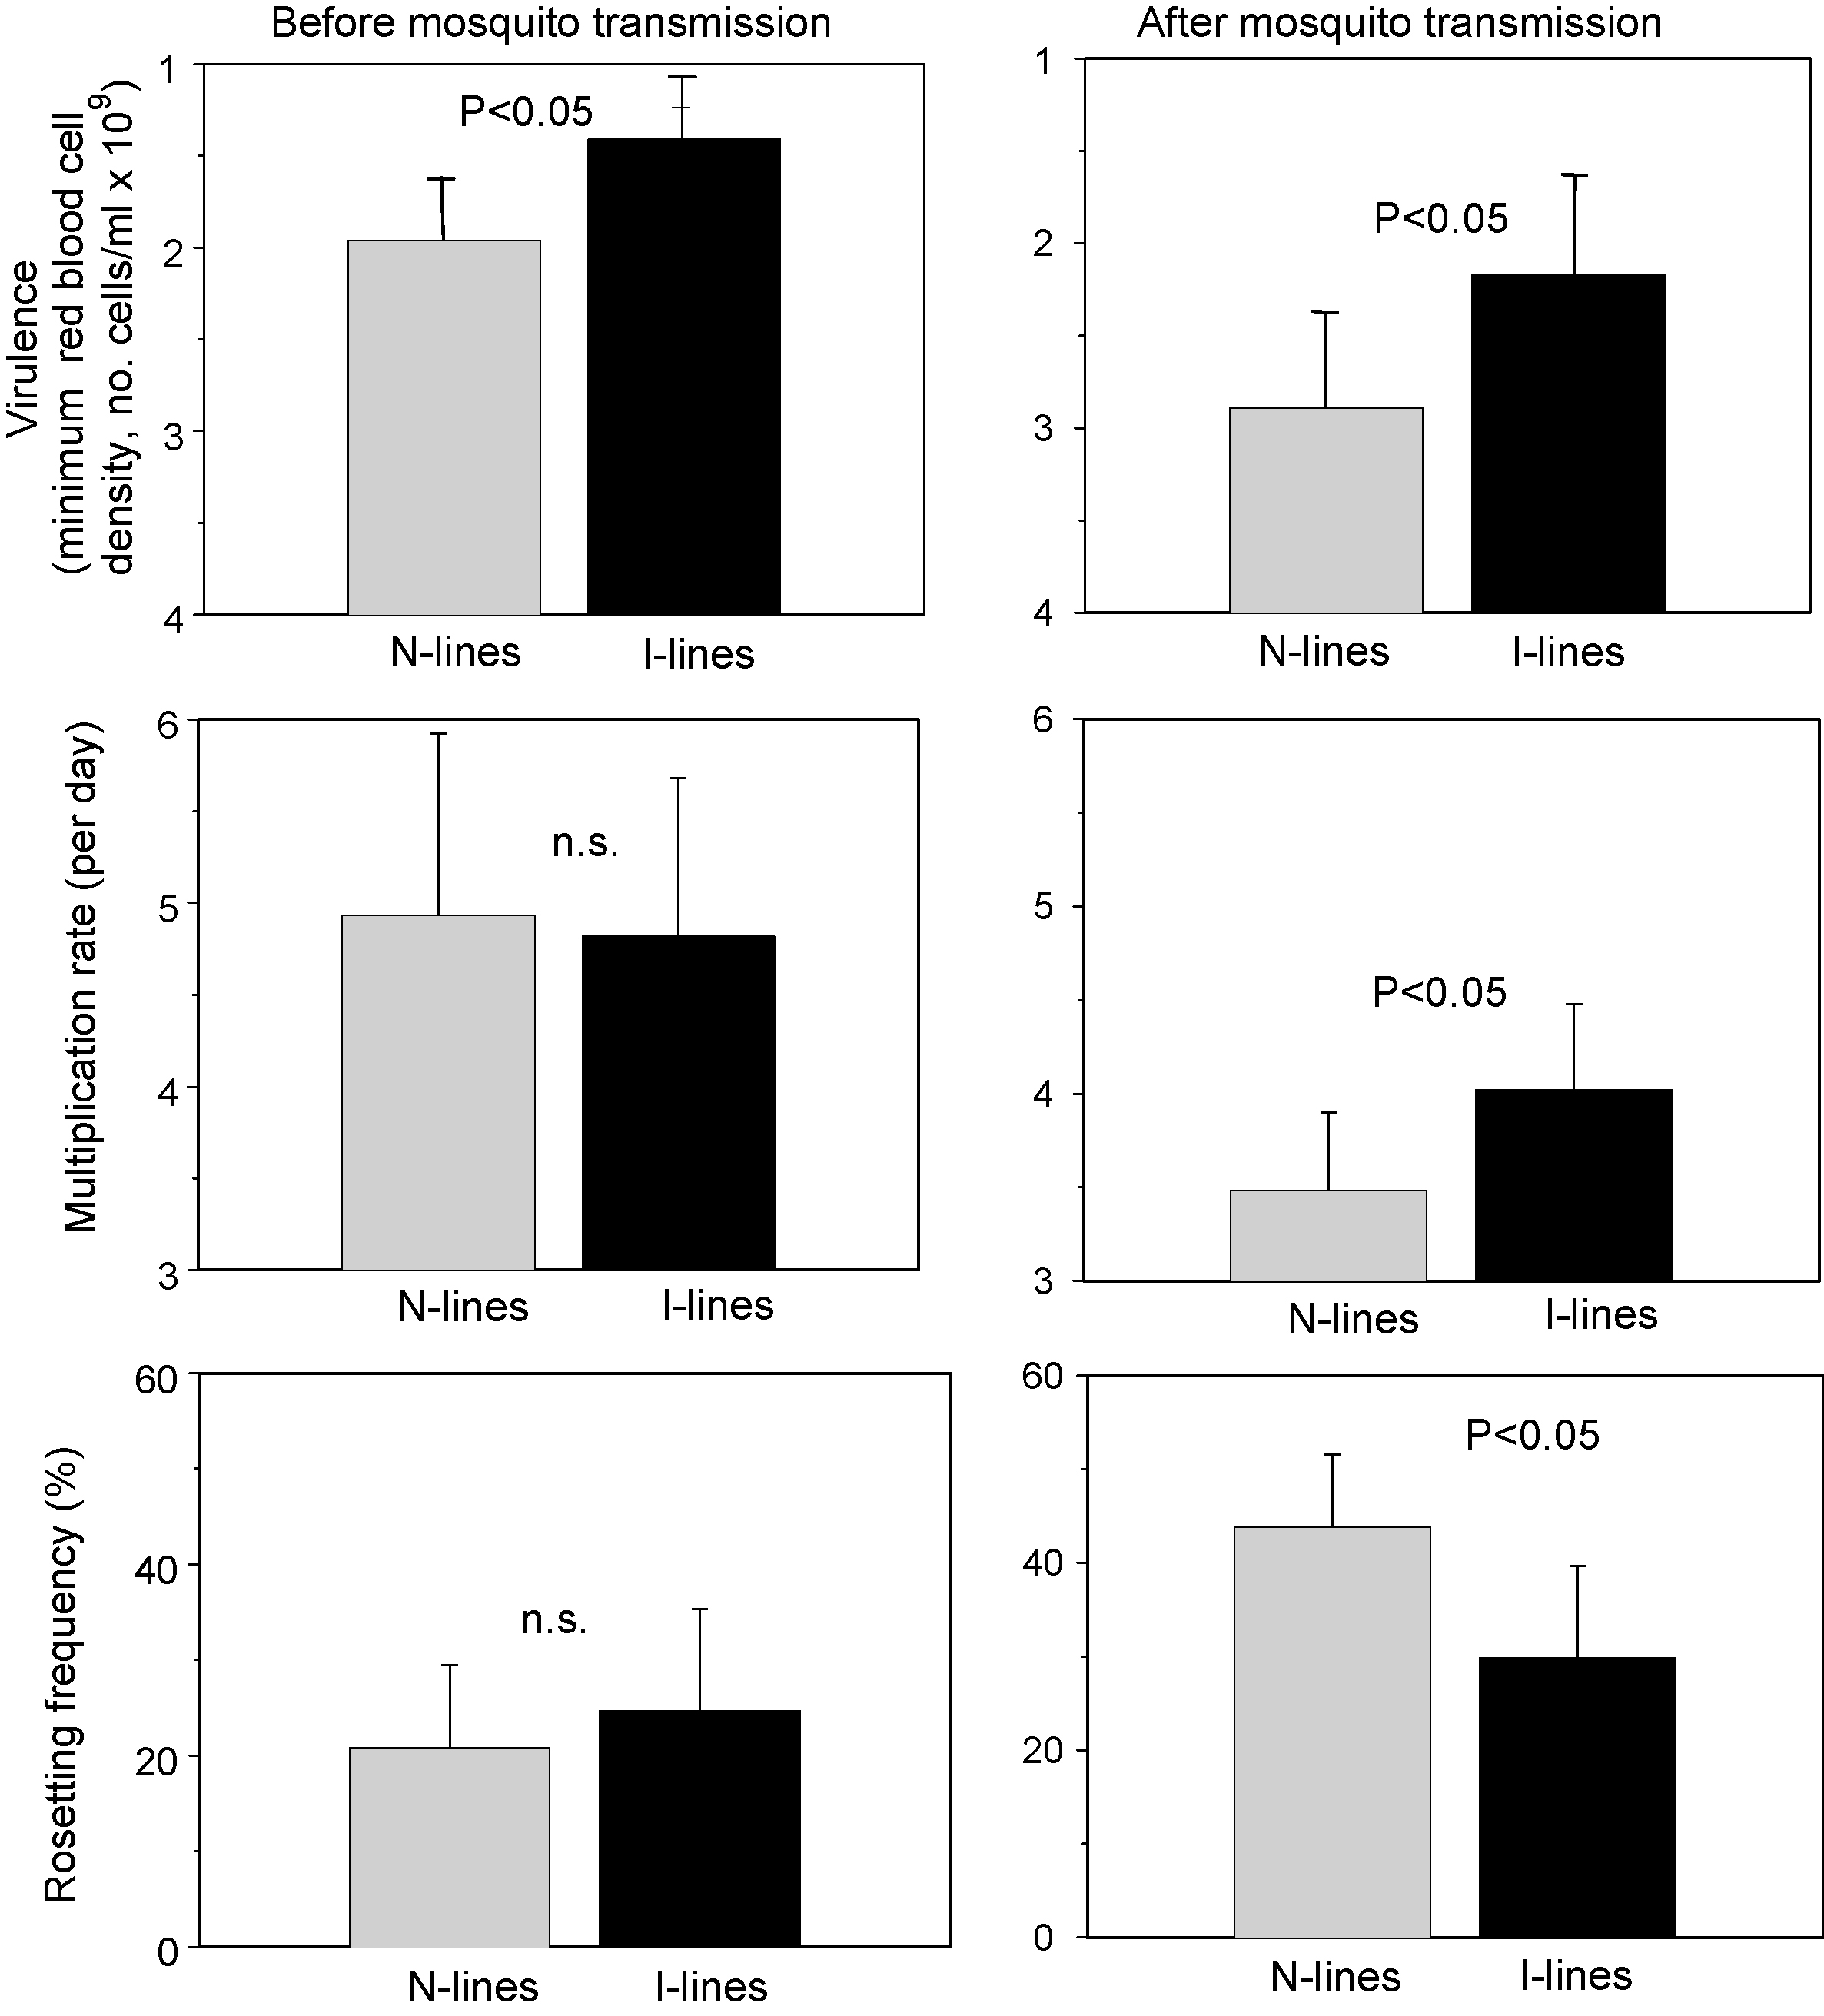
Results of serial passage of P. chabaudi through either immunised (I-lines) vs. naïve (N-lines) mice. Starting with an avirulent clone, five independent parasite lines were blood-passaged in mice every 7 days for 18 passages (see , for further details of the experimental design). At the end, the lines were passaged through mosquitoes once, and then compared for their virulence (measured by the minimum blood cell density reached during the infection), the rate of population growth during the first 6 days using real-time PCR (see for details of methods), and rosetting frequency (the proportion of infected red blood cells that bind to more than two uninfected cells thus forming clusters, and the only molecular phenotype in human malaria that is consistently associated with virulence [85], [86], [87], [88]). Heights of bars represent means (with 95% confidence intervals) of groups of mice infected with the five selection lines per selection treatment. Selection in immunised mice generated more virulent parasites than in naïve mice indicating that immunity selects more intensively for virulent forms during within-host selection. These differences were present in the lines both before (graphs on left) and after (right) mosquito transmission indicating that at least some of the evolved difference was genetically stable. These parasites also multiplied faster during the early, non-growth-limiting stage of the infection before the onset of disease and a strong immune response. This difference was not apparent in the lines before mosquito transmission, probably due to the maximum growth potential (around fivefold per day [23]) having been reached. Rosetting was also the same in the two sets of lines before mosquito transmission but different after transmission, and in the opposite direction to that expected from human malaria, i.e., it was lower in the most virulent lines. Differences between pre-and post-mosquito transmission were significant for all three traits (virulence, P < 0.05; multiplication rate, P < 0.001; rosetting, P < 0.05). Data in the top two figures are reproduced with permission from Mackinnon and Read .
References
-
- Williams G.C., Nesse R.M. The dawn of Darwinian medicine. Quart Rev Biol. 1991;66:1–22. - PubMed
-
- Dieckmann U., Metz J.A.J., Sabelis M.W., Sigmund K. Cambridge University Press; Cambridge: 2002. Virulence management: the adaptive dynamics of pathogen–host interactions.
-
- Levin B.R., Bull J.J. Short-sighted evolution and the virulence of pathogenic microorganisms. Trends Microbiol. 1994;2:76–81. - PubMed
-
- Frank S.A. Models of parasite virulence. Quart Rev Biol. 1996;71:37–78. - PubMed
-
- Topley W.W.C. The spread of bacterial infection. Lancet. 1919;194:1–5.
Publication types
MeSH terms
Substances
Grants and funding
LinkOut - more resources
Full Text Sources
Medical
