. 2008 Sep 5;134(5):828-42.
doi: 10.1016/j.cell.2008.06.054.

Coronin 1B antagonizes cortactin and remodels Arp2/3-containing actin branches in lamellipodia

Affiliations

Coronin 1B antagonizes cortactin and remodels Arp2/3-containing actin branches in lamellipodia

Liang Cai et al. Cell. .

Abstract

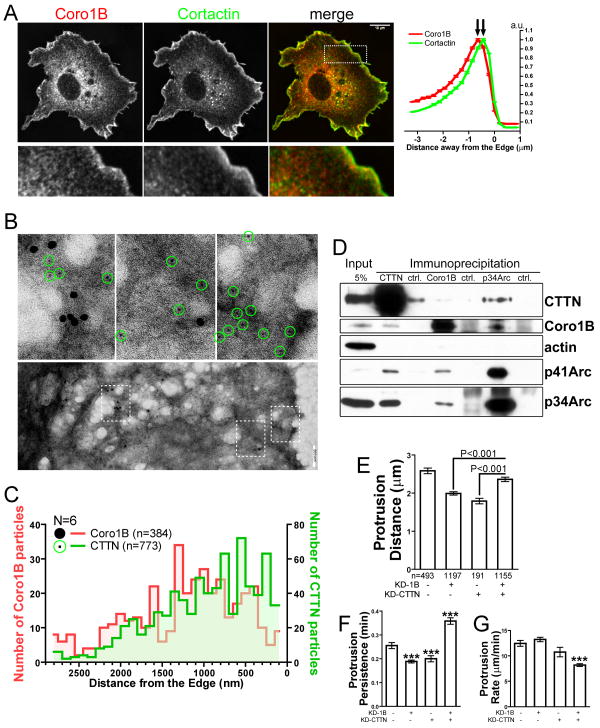
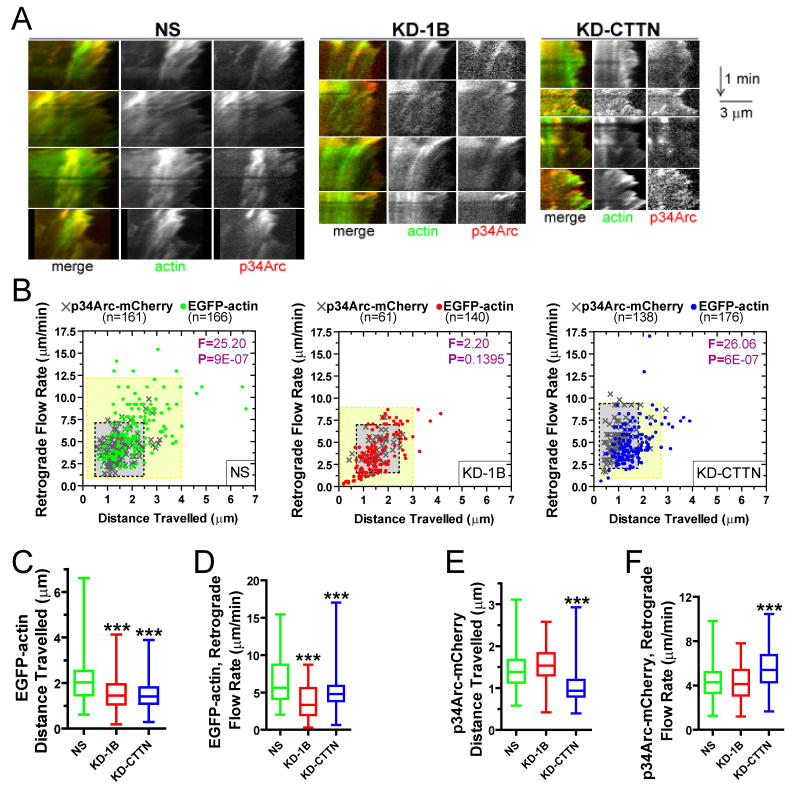
The dendritic actin network generated by the Arp2/3 complex in lamellipodia underlies formation of protrusions, directional sensing, and migration. While the generation of this network is well studied, the mechanisms regulating network disassembly are poorly understood. We report that Coronin 1B disassembles Arp2/3-containing actin filament branches by inducing Arp2/3 dissociation. This activity is antagonized by Cortactin, a filament branch stabilizer. Consistent with this biochemical competition, depletion of both proteins partially rescues defects in lamellipodial dynamics observed upon depletion of either protein alone. Coronin 1B targets actin branches in a manner that is mutually exclusive with the Arp2/3 complex and alters the branch angle. We conclude that Coronin 1B replaces the Arp2/3 complex at actin filament branches as the dendritic network matures and drives the turnover of branched actin networks.


Figures

Figure 1
Figure 1. Coronin 1B and Cortactin localize differentially in lamellipodia and function antagonistically during protrusion
A- Rat2 cells were immunolabeled for endogenous Coronin 1B and Cortactin. Normalized pixel intensities of Coronin 1B and Cortactin plotted as a function of distance from the cell edge (mean ± SEM). Scale bar = 10 μm. B- Lower panels: Negative stained electron micrographs of lamellipodia in Rat2 cells immunolabeled for Coronin 1B (18-nm gold particles) and Cortactin (6-nm gold particles). Higher-mag views of boxed regions are presented in upper panels with 6-nm gold particles circled in green. Scale bar = 200 nm. C- Distribution of distances from the cell edge of gold particles labeling Coronin 1B (red) and Cortactin (green). Student's t test of the distance from the edge is p<0.0001 (N=cells; n=particles counted). D- Lysates of Rat2 cells immunoprecipitated with antibodies to Cortactin, Coronin 1B, p34Arc or control IgG (ctrl.) and immunoblotted with indicated antibodies. E,F,G- Protrusion parameters of Rat2 cells expressing Coronin 1B shRNA (KD-1B), Cortactin shRNA (KD-CTTN), or both. Data presented are mean ± 95% CI from >7 cells in each category (n=number of protrusive events). Newman-Keuls multiple comparison test was used after one-way ANOVA to generate the p values.
Figure 2
Figure 2. Coronin 1B antagonizes Cortactin in vitro and induces debranching
A- Actin polymer concentration versus time in reactions containing 1.5μM actin (5% pyrene labeled), 20nM Arp2/3 complex, 1nM VCA, and Coronin 1B and Cortactin as indicated. Other curves: actin only (yellow), 1nM VCA & actin (grey) and Arp2/3 & actin (tan). B- Maximal rates of actin assembly by Arp2/3 and VCA/Cortactin at various Coronin 1B concentrations. Data are normalized to the maximal assembly rate assembly by Arp2/3 and VCA without Cortactin. Data presented as mean ± SEM (N=4 independent experiments). One-phase exponential decay was fit to the data to calculate the IC50. C- Actin (0.5μM, 30% Oregon green labeled) filaments growing in the presence of 13.3nM Arp2/3 and 13.3nM VCA ± 50nM Coronin 1B observed by TIRF. Scale bars = 4μm. D- High-mag view of filament debranching observed in reactions from (C). Red arrows indicate actin branch disassembly events. Scale bars = 3μm. E- Debranching frequency was calculated from TIRF movies as in (C) except that NEM-myosin was omitted to allow increased daughter filament detachment upon debranching. Data are presented as a box and whisker plot. Dunnett's multiple comparison test was used after one-way ANOVA to generate the p values. Data compiled from 3 independent experiments; number of debranching events indicated by n. F- The number of actin branches/field (1400 μm2) was plotted as a function of time. Actin (0.5μM, 30% Oregon green labeled), 13.3nM Arp2/3, 13.3nM VCA, and indicated amounts of Cortactin and Coronin 1B were mixed immediately before the reactions started. Data are presented as mean ± SEM from 4 fields for each condition. G- Schematic diagram of the second-wave debranching assay: 0.5 μM unlabeled G-actin (gray dots) with 13.3 nM Arp2/3 complex (blue) and 13.3 nM VCA (step 0). Actin polymerization proceeds for 10 min (step 1). Flow protein mixtures (a-h) containing 0.8 μM Capping protein and without G-actin, VCA or Arp2/3 complex into the reaction chambers for 2 min (step 2). Flush chamber with Rhodamine-phalloidin in imaging buffer to stop the reactions (step 3, red lines), and capture images. H- Second-wave branch densities (a-f) were calculated from 18 fields (2 independent experiments) and presented in a box and whisker plot. Dunnett's multiple comparison test was used after one-way ANOVA to generate the p values (*, p< 0.05; ***, p<0.0001).
Figure 3
Figure 3. Coronin 1B dissociates Arp2/3 complex from the sides of actin filaments
A- Reactions contained 20 nM Arp2/3, 1 nM VCA, 1.5 μM actin and indicated amounts of Coronin 1B and/or Cortactin; polymerization proceeded 30 min at room temperature followed by sedimentation to pellet F-actin. Samples were separated by SDS-PAGE and Coomassie Blue stained or immunoblotted with indicated antibodies. Short/Long indicates duration of exposure of the immunoblot to film. B,C,D- Pre-formed F-actin stabilized by phalloidin was mixed with 20 nM Arp2/3 complex and incubated at 4°C ON. Reactions were subjected to ultra-centrifugation to pellet F-actin and pellets suspended in phalloidin-containing MKEI-50 buffer. Samples were negative stainied and visualized by TEM. (B) reaction mixture before centrifugation; (C) supernatant; (D) resuspended pellet. Yellow arrowheads indicate Arp2/3 complex in association with actin filaments. Scale bars = 100 nm. E- Actin (1.5 μM) filaments nucleated by Spectrin F-actin seeds (SAS) or spontaneously were pre-formed for 30 min and mixed with 50 nM Arp2/3 complex and the indicated concentrations of Coronin 1B and/or Cortactin for an additional 30 min. Reactions were incubated at room temperature and processed as in (A). F- Actin (1.5 μM) filaments initiated by SAS were mixed with 25 nM Arp2/3 complex for 30 min at room temperature and then varying concentrations of Coronin 1B were added and reactions were incubated at 4°C overnight to reach equilibrium. Pellet samples were obtained and processed as in (A). G- Reactions as in (F) with varying concentrations of Cortactin. Arp2/3 complex in pellet was quantified by densitometry and normalized to that in reactions lacking cortactin. Data from 7 independent experiments are presented as (mean ± SEM). One-phase exponential function was used to fit the data and calculate the EC50. H- Experiments as in (F) with varying concentrations of Coronin 1B were analyzed as in (G). Data were compiled from the indicated number (N) of independent experiments. One-phase exponential decay was used to fit the data and calculate the IC50. I,J- Actin (2 μM) filaments were pre-formed by spontaneous nucleation for 1 hr, mixed with indicated amounts of Coronin 1B and Cortactin, incubated at 4°C overnight to reach equilibrium and processed as in (A).
Figure 4
Figure 4. Coronin 1B localizes to actin branches in vitro and in vivo
A- Reactions containing 20 nM Arp2/3, 1 nM VCA and 1.5 μM actin were mixed with 2 μM phalloidin and incubated at 4°C overnight to reach equilibrium. An equal volume of 0.56 μM Coronin 1B, 0.63 μM Cortactin or buffer was added to each reaction 5 min before negative staining. Samples were visualized by TEM. Yellow arrowheads indicate abnormal actin branch structures. Scale bars = 100 nm. B- Angles between the mother and daughter filaments were quantified and presented as mean ± 95% CI. Dunnett's multiple comparison test was used after one-way ANOVA to generate the p values (***, p<0.0001). C- Actin (0.5 μM, 30% Oregon green labeled) was mixed 26 nM Arp2/3 complex and 37 nM VCA and actin branches were allowed to form in the flow chamber. After 20 min (time point 0 in the panel), 0.13 nM AlexaFluor-568 labeled Coronin 1B (labeled with ∼one dye molecule/protein) in imaging buffer was flowed into the chamber. Scale bars = 1 μm. D- Reactions containing 20 nM Arp2/3, 1 nM VCA, 1.5 μM actin and either 150 nM Coronin 1B or 60 nM Cortactin were mixed with 1:100 dilution of primary antibodies, 1:25 dilution of colloidal gold secondary antibodies and 2 μM phalloidin and incubated at 4°C overnight. Samples were prepared by negative staining and visualized by TEM. Anti rabbit secondary antibodies were conjugated to 18-nm gold; anti-mouse secondary antibodies were conjugated to 6-nm gold. Stains: 1, polyclonal anti-Coronin 1B; 2, monoclonal anti-His tag (Coronin 1B-His); 3, polyclonal anti-p34Arc; 4, monoclonal anti-Cortactin; 5-6, monoclonal anti-Cortactin and polyclonal anti-p34Arc. Green circles highlight the 6-nm colloidal gold particles. Scale bars = 100 nm. E- Samples were processed as in (D). Data compiled from 3 independent experiments. Chi squared test between the Cortactin-stained group (1) and the Coronin 1B-stained group (2) shows p = 0.0021. An expanded version of this table including staining controls is in the supplemental data section. F- Platinum replica electron micrographs of lamellipodia in mouse embryo fibroblasts (MEF) immunolabeled for Coronin 1B with 18-nm gold (white dots). Expanded views of boxed regions (a-f) are presented in the lower panels; gold particles indicated by yellow arrowheads. Scale bar = 500 nm. G,H- MEF cells were treated with either 0.05 μM or 0.1 μM cytochalasin D for 10 min and immunolabeled for Coronin 1B (G) or Arp2/3 complex (H). Yellow arrowheads indicate actin branches containing gold particles. Scale bars = 50 nm. I- The distribution of Coronin 1B-labeled (red) or Arp2/3-labeled (green) actin branch angles. The 3D nature of platinum replica EM likely leads to a slight under-estimation of branch angle. Data compiled from 3 independent experiments. Student's t test of the branch angle shows p<0.001; (N = number of cells, n = number of branches).
Figure 5
Figure 5. Targeting of active Coronin 1B to the plasma membrane alters actin filament architecture and lamellipodial protrusion dynamics
A- Schematic diagram of WT-GAAX; Coronin 1B S2A-GAAX is designated S2A-GAAX. B- Rat2 cells expressing WT-GAAX were immunolabeled for p34Arc and F-actin. Scale bar = 5 μm. C- Lysates from HEK293 cells expressing Coronin 1B-EGFP or WT-GAAX were immunoprecipitated with antibodies to GFP and immunoblotted with indicated antibodies. Cells were treated with or without 100 nM PMA for 30 minutes before lysis. D- Rat2 cells expressing S2A-GAAX were immunolabeled as in (B). E- The pixel intensity of p34Arc and F-actin were plotted vs. distance from the cell edge (mean ± SEM; N = number of cells). GFP fluorescence from both cell lines showed equal expression of WT-GAAX and S2A-GAAX (data not shown). F- The ratio of p34Arc to F-actin intensity is plotted vs. distance from the cell edge (mean ± SEM). G,H- Platinum replica electron micrographs of lamellipodia in Rat2 cells expressing WT-GAAX (H) or S2A-GAAX (G). Expanded views of boxed regions are presented on the right. Scale bars = 500 nm. I- Actin filament densities of images as in panel G and H were quantified and plotted with distance away from the cell edge (mean ± SEM; N = number of cells). J,K,L- Protrusion parameters of Rat2 cells expressing soluble Coronin 1B-GFP, WT-GAAX, or S2A-GAAX. Data are presented as mean ± 95% CI. Dunnett's multiple comparison test was used after one-way ANOVA to generate the p values against the control. >4 cells from each category were analyzed, n = number of protrusion events analyzed.
Figure 6
Figure 6. Coronin 1B, Cortactin an Arp2/3 complex have distinct dynamics in vivo
A- Retrograde flow rate and distance travelled during retrograde flow of EGFP-tagged actin/actin-binding proteins presented as a scatter plot; >6 cells from each category were analyzed. B- Distance traveled parameter from (A) presented as a box and whisker plot. (n = number of events analyzed) C- Representative kymographs showing retrograde flow of EGFP tagged proteins: EGFP-actin, Cortactin-EGFP, p34Arc-EGFP and Coronin 1B-EGFP. Horizontal lines = 5 μm; vertical lines = 1 min. Yellow solid line illustrates distance travelled; the angle α was used to calculate the retrograde flow rate. D- Normalized fluorescence intensity profiles of Coronin 1B-mCherry and p34Arc-EGFP expressed in Rat2 cells were extracted at varying distance from the cell edge. Three line profiles obtained 0, -0.4, -0.9 μm from the cell edge are shown; these data were used in (E) to calculate the correlation coefficient. E- Line profiles were extracted as described in (D) for pair-wise combinations of labeled proteins. Each profile was used to calculate Pearson's correlation coefficient between the red and green channel. Results from >6 cells were grouped and plotted as a function of distance from the cell edge (mean ± SEM; N = number of protrusion events) F- Kymographs were generated from a Rat2 cell expressing Cortactin-mCherry and p34Arc-EGFP (two examples shown). Left panel shows fluorescence intensity profiles of the two channels extracted from five lines as indicated on the kymograph. Horizontal lines = 1 μm; vertical lines = 1 minute. G- Kymographs were generated from a Rat2 cell expressing Coronin 1B-mCherry and p34Arc-EGFP (two examples shown). Left panel shows fluorescence intensity profiles of the two channels extracted from five lines as indicated on the kymograph. The peak pixel intensity of both channels closest to the cell edge was traced and presented in the middle. Normalized fluorescence intensity profiles were extracted based on the distance from the cell edge. Profiles with 0, -0.4, -0.9 μm from the cell edge were plotted on the right, which are examples used in (H) for coefficient calculation. H- Line profiles based on the distance to the cell edge were extracted as described in (G) from Rat2 cells expressing pair-wise combinations of fluorescent proteins. Each line profile with a given distance from the cell edge was used to calculate Pearson's correlation coefficient between the channels. Results from >6 cells were grouped together and plotted as a function of distance from the cell edge (mean ± SEM; N = number of flow events)
Figure 7
Figure 7. Depletion of either Coronin 1B or Cortactin affects the relative dynamics of Arp2/3 complex and actin in lamellipodia
A- Kymographs showing retrograde flow of EGFP-actin and p34Arc-mCherry in cells expressing the indicated shRNA. Horizontal lines = 3 μm; vertical lines = 1 min. B- Retrograde flow rate and distance traveled of EGFP-actin (dots) and p34Arc-mCherry (crosses) presented as scatter plots from cells expressing the indicated shRNAs; >16 cells from each category were analyzed. Yellow boxes represent the mean of actin for both parameters ± 2×SD (95% of data points); gray boxes represent the mean of p34Arc for both parameters ± 2×SD. Analysis of covariance was used to generate the F and P values for each condition. (n = number of flow events) C,D- Distance traveled during retrograde flow of (B) presented as box and whisker plots. Dunnett's multiple comparison test was used after one-way ANOVA to generate the p values against the control (***, P<0.0001). E,F- Retrograde flow rates for EGFP-actin and pArc34-mCherry of (B) was processed as in (C,D)

Similar articles

Cited by

References

    1. Amann KJ, Pollard TD. Direct real-time observation of actin filament branching mediated by Arp2/3 complex using total internal reflection fluorescence microscopy. Proc Natl Acad Sci U S A. 2001;98:15009–15013. - PMC - PubMed
    1. Anes E, Kuhnel MP, Bos E, Moniz-Pereira J, Habermann A, Griffiths G. Selected lipids activate phagosome actin assembly and maturation resulting in killing of pathogenic mycobacteria. Nat Cell Biol. 2003;5:793–802. - PubMed
    1. Blanchoin L, Pollard TD, Mullins RD. Interactions of ADF/cofilin, Arp2/3 complex, capping protein and profilin in remodeling of branched actin filament networks. Curr Biol. 2000;10:1273–1282. - PubMed
    1. Bryce NS, Clark ES, Leysath JL, Currie JD, Webb DJ, Weaver AM. Cortactin promotes cell motility by enhancing lamellipodial persistence. Curr Biol. 2005;15:1276–1285. - PubMed
    1. Cai L, Holoweckyj N, Schaller MD, Bear JE. Phosphorylation of coronin 1B by protein kinase C regulates interaction with Arp2/3 and cell motility. J Biol Chem. 2005;280:31913–31923. - PubMed

Publication types