. 2008 Sep 26;103(7):e81-95.
doi: 10.1161/CIRCRESAHA.108.185249. Epub 2008 Sep 5.

Physiological properties of hERG 1a/1b heteromeric currents and a hERG 1b-specific mutation associated with Long-QT syndrome

Affiliations

Physiological properties of hERG 1a/1b heteromeric currents and a hERG 1b-specific mutation associated with Long-QT syndrome

Harinath Sale et al. Circ Res. .

Abstract

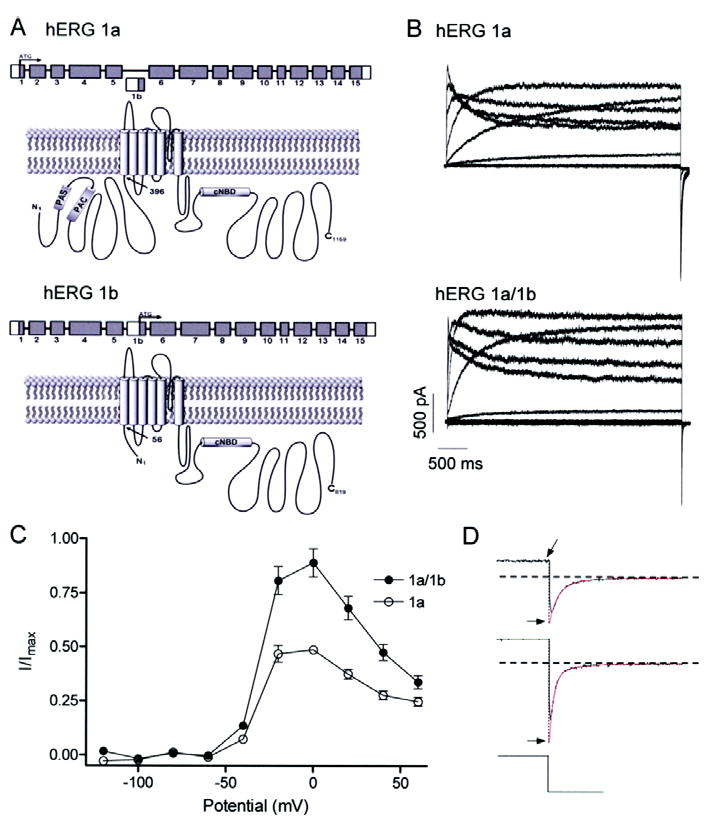
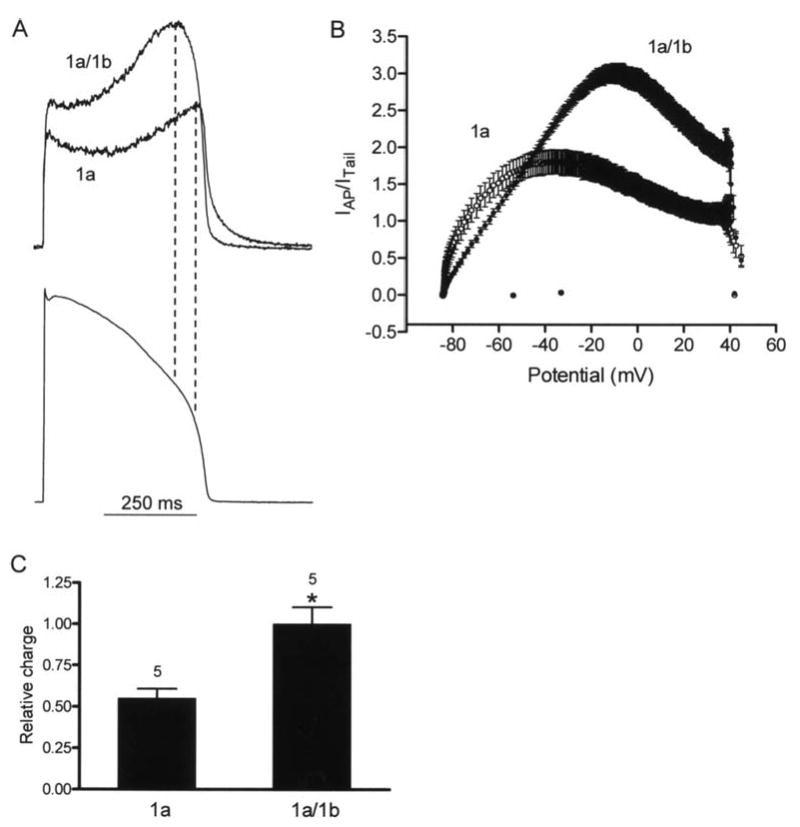
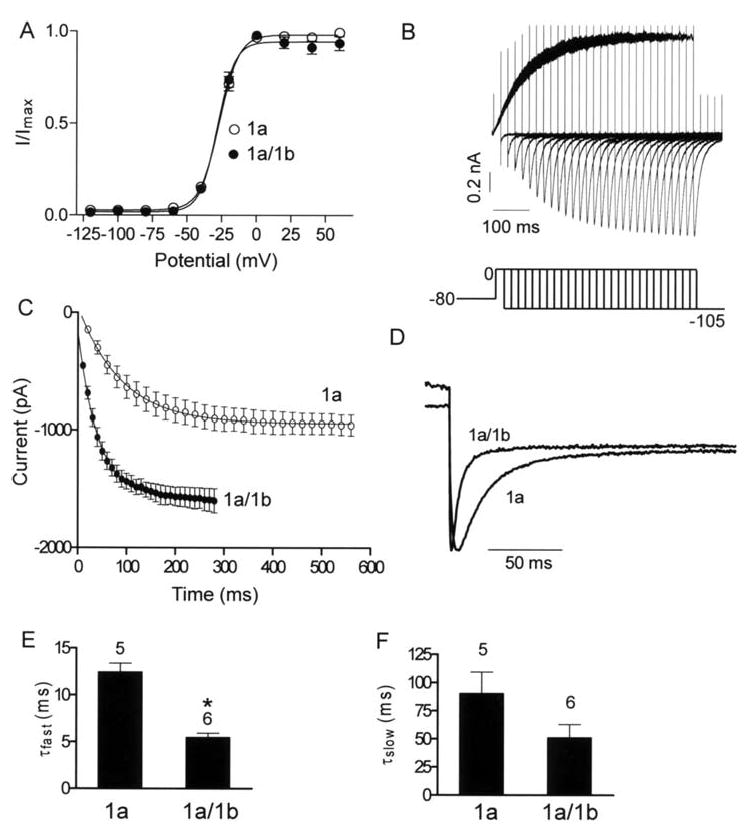
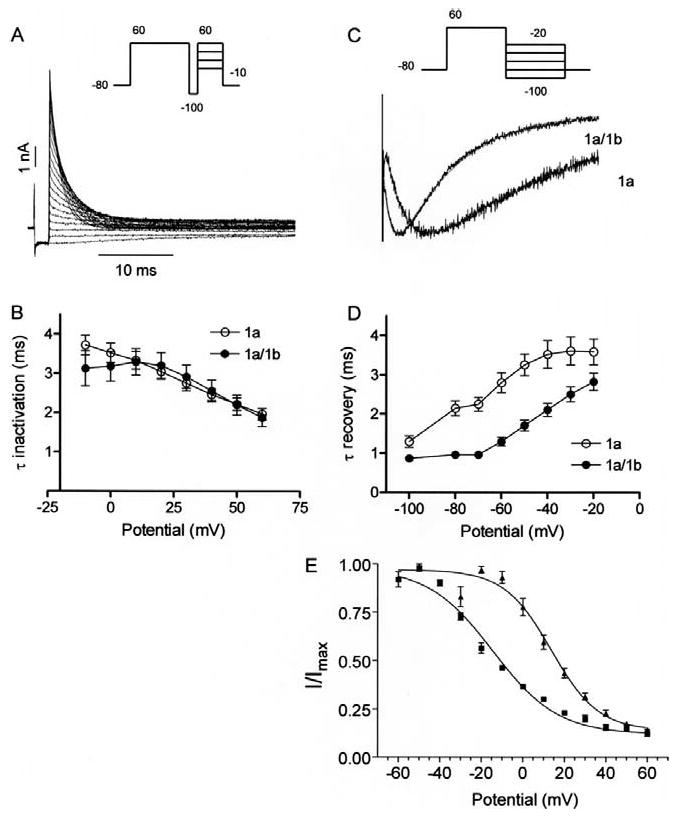
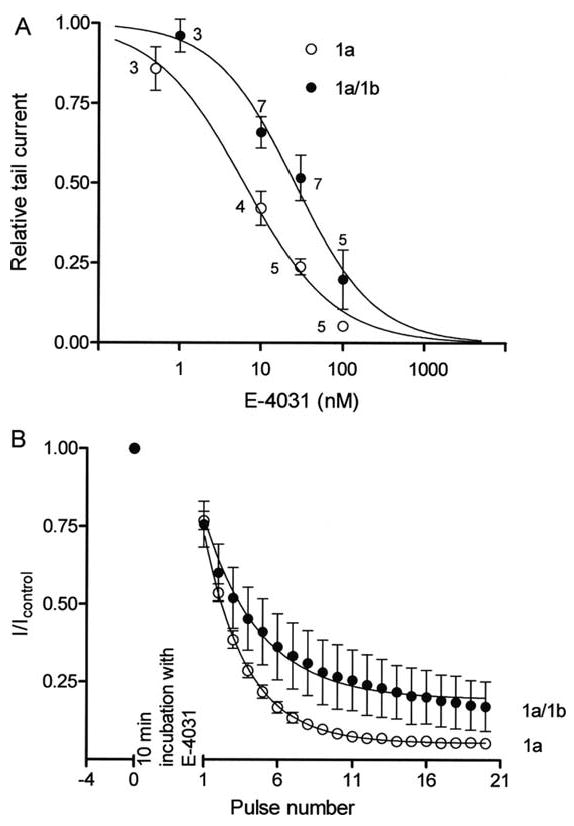
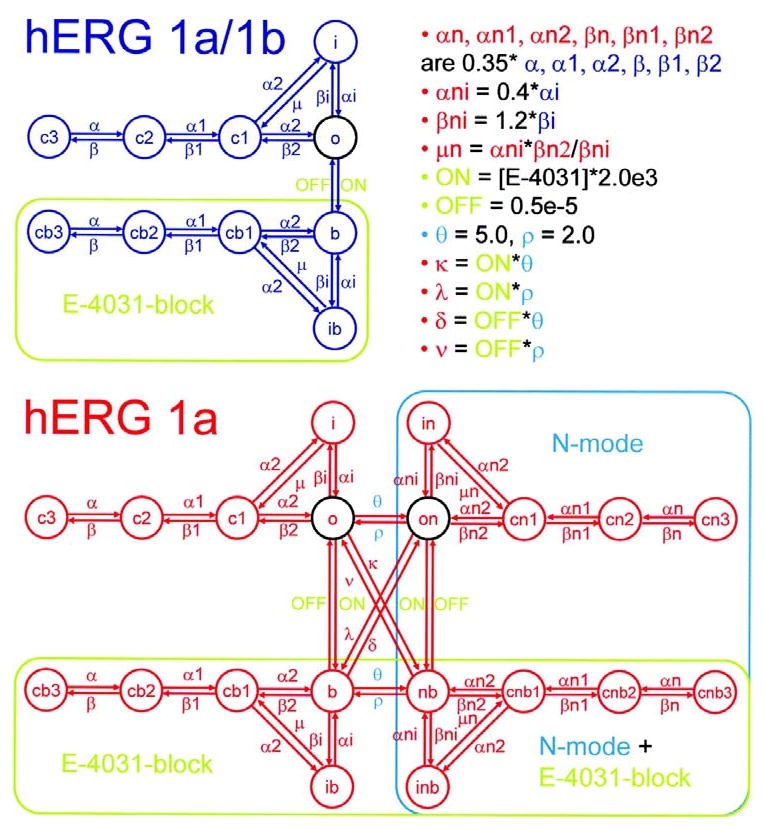
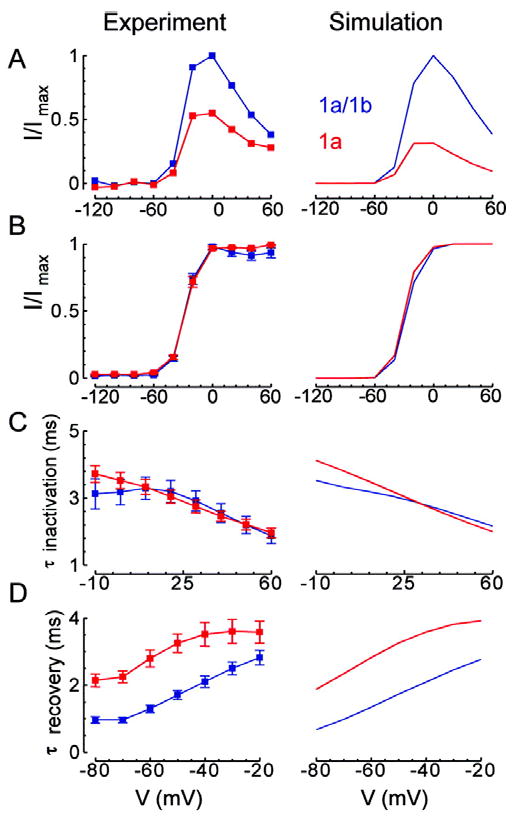
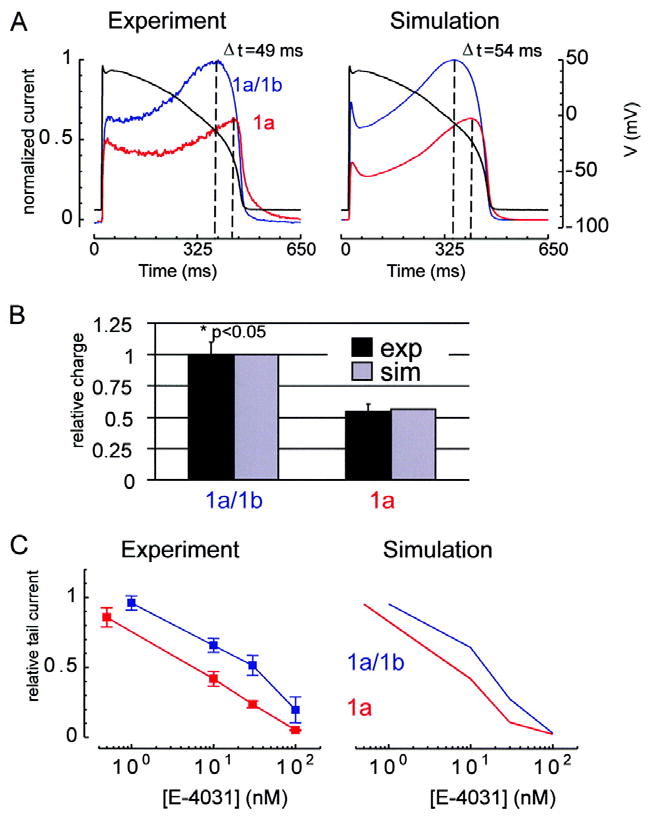
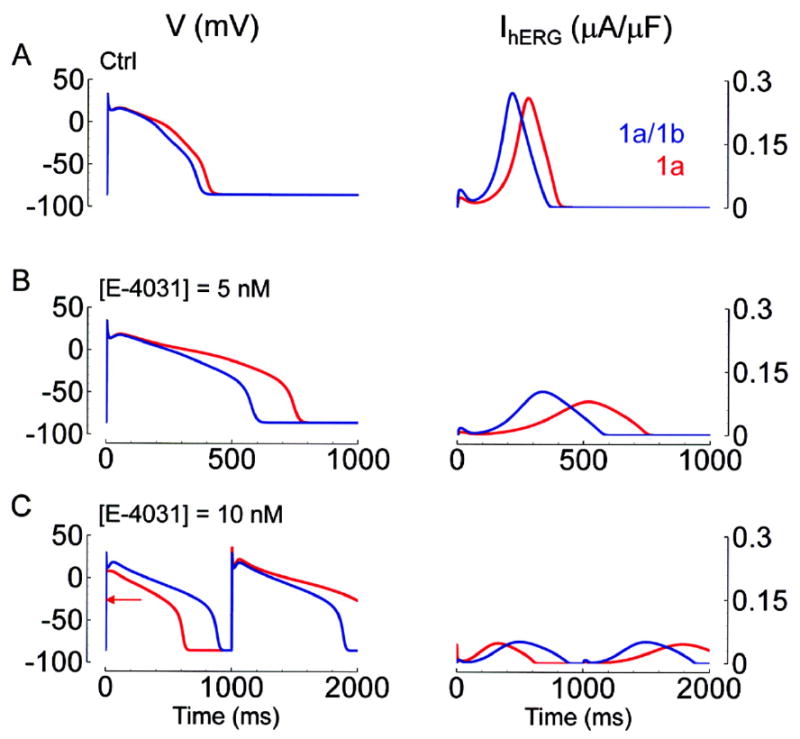
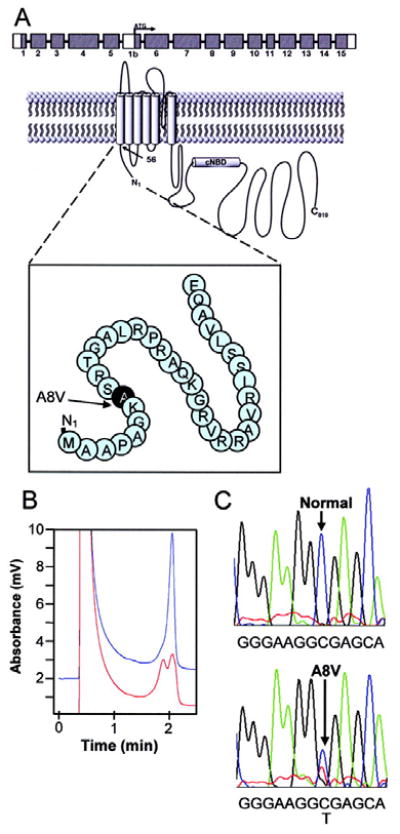
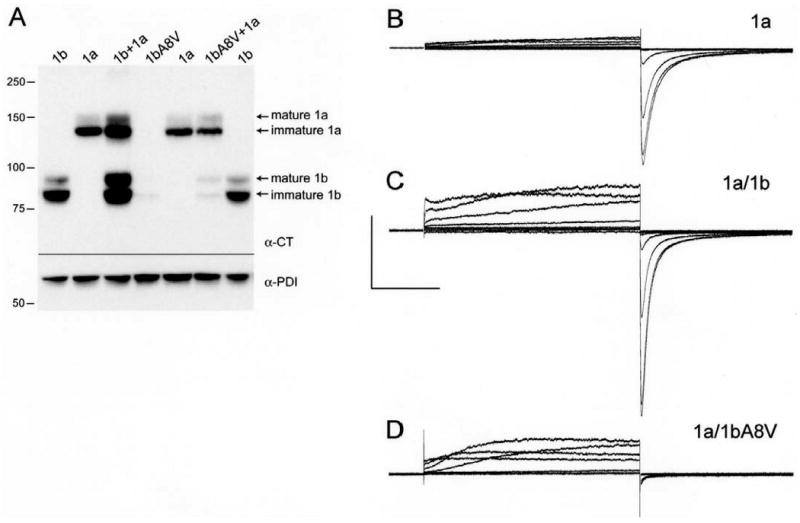
Cardiac I Kr is a critical repolarizing current in the heart and a target for inherited and acquired long-QT syndrome (LQTS). Biochemical and functional studies have demonstrated that I Kr channels are heteromers composed of both hERG 1a and 1b subunits, yet our current understanding of I Kr functional properties derives primarily from studies of homooligomers of the original hERG 1a isolate. Here, we examine currents produced by hERG 1a and 1a/1b channels expressed in HEK-293 cells at near-physiological temperatures. We find that heteromeric hERG 1a/1b currents are much larger than hERG 1a currents and conduct 80% more charge during an action potential. This surprising difference corresponds to a 2-fold increase in the apparent rates of activation and recovery from inactivation, thus reducing rectification and facilitating current rebound during repolarization. Kinetic modeling shows these gating differences account quantitatively for the differences in current amplitude between the 2 channel types. Drug sensitivity was also different. Compared to homomeric 1a channels, heteromeric 1a/1b channels were inhibited by E-4031 with a slower time course and a corresponding 4-fold shift in the IC50. The importance of hERG 1b in vivo is supported by the identification of a 1b-specific A8V missense mutation in 1/269 unrelated genotype-negative LQTS patients that was absent in 400 control alleles. Mutant 1bA8V expressed alone or with hERG 1a in HEK-293 cells dramatically reduced 1b protein levels. Thus, mutations specifically disrupting hERG 1b function are expected to reduce cardiac I Kr and enhance drug sensitivity, and represent a potential mechanism underlying inherited or acquired LQTS.


Figures

Fig 1
Fig 1
Greater amplitude currents for hERG 1a/1b compared to hERG 1a channels. A, graphic showing N-terminal differences in primary structure between hERG 1a (upper) and hERG 1b (lower). Cytoplasmic N and C termini flank the hydrophobic core. N-terminal differences yield subunits of 1159 and 819 amino acid residues for hERG 1a and 1b, respectively. “PAS”, Per-Arnt-Sim domain; “PAC”, PAS-associated C-terminal domain; “CNBD”, putative cyclic nucleotide binding domain; “TCC”, tetramerization coiled-coil domain. B, currents from stably transfected hERG 1a cells (upper) or hERG 1a stable cells transiently transfected with hERG 1b (lower). All currents were recorded at 34 ± 2°C in response to series of 4-s depolarizing voltage steps ranging from -120 to 60 mV followed by a 5-s repolarizing step to -50 mV. C, steady state current-voltage relations of hERG 1a and hERG 1a/1b channels, both displaying the hallmark negative slope conductance (n = 5 - 6 for both). The currents at the end of each depolarizing pulse were normalized to the absolute value of the extrapolated maximum tail current and plotted as a function of membrane potential. D, double exponential fits (in red) of tail currents evoked following a step to 60 mV extrapolated back to the moment of voltage change to obtain peak current value (Imax; see Methods).
Fig 2
Fig 2
hERG 1a and 1a/1b currents during cardiac action potential clamp. A, upper panel, representative current profiles of hERG 1a/1b and 1a channels recorded at 34 ± 2°C. Currents were normalized to peak tail currents elicited at -105 mV following a prepulse to 60 mV to compare current amplitudes and differences in rectification for a given channel density. Lower panel, voltage command was a digitized rabbit ventricular action potential as previously described . B, real-time I-V plots of current for 1a/1b and 1a channels during action potential clamp. Each point is the mean ± s.e.m of five cells. C, relative charge transferred during an action potential command. Values were obtained by integrating the normalized current traces (432.4 ± 45.9 and 786.6 ± 80.7 for 1a and 1a/1b, respectively) and were plotted with an additional normalization to the 1a/1b values. * indicates P < 0.05, Mann Whitney test.
Fig 3
Fig 3
Activation and deactivation properties of hERG 1a and 1a/1b channels. A, Steady-state activation plots. Tail current amplitudes during the -105 mV step were normalized to the maximum tail current amplitude and plotted as a function of the preceding depolarization step to obtain the steady-state activation plots. The line of best fit is a Boltzmann function (Materials and Methods). The V1/2 and the slope factor for 1a channels are -26.8 ± 1.3 mV and 6.9 ± 0.2, (n = 6); and for 1a/1b channels -28.6 ± 1.0 mV and 6.2 ± 0.1, respectively (n = 5; P > 0.05, Mann Whitney test). B, currents evoked using an envelope of tails protocol to determine time course of activation. Peak inward tail currents were evoked by a step to -105 mV following a prepulse of increasing duration to 0 mV. Holding potential was -80 mV. C, apparent activation is faster for hERG 1a/1b compared with hERG 1a currents. The peak amplitudes of the tail currents (B) were plotted against test pulse duration and fit to single exponential function. Time constants of activation were 98.7 ± 17.6 ms and 41.6 ± 6.7 ms for hERG 1a and 1a/1b, respectively. Each point is the mean ± s.e.m of four to six cells. D, deactivation is faster for hERG 1a/1b vs. hERG 1a currents. Scaled tail currents recorded at -105 mV are shown. E & F, time constants of fast and slow components from double exponential fits to deactivating tail currents are plotted for comparison between 1a and 1a/1b channels. * indicates P < 0.05, Mann Whitney test. Temperature is 34 ± 2°C.
Fig 4
Fig 4
Inactivation properties of hERG 1a and 1a/1b channels. A, hERG currents elicited by the three-pulse protocol to measure the time course of inactivation. A 500-ms pulse to 60 mV to activate and then inactivate hERG is followed by a 2 ms pulse to -100 mV to remove the inactivation. In the third pulse varying the potential between -10 and 60 mV allowed the inactivation time course to be measured as a function of voltage. B, the time constants for onset of inactivation are estimated by fitting the decay of the currents in the third pulse to a single exponential function and plotted as a function of test potential. There were no significant differences in the time constants of inactivation for hERG1a and hERG1a/1b channels. Each point is the mean ± s.e.m of four to six cells (P > 0.05, Mann Whitney test). C, exemplary tail currents with double exponential fits (red) showing faster recovery from inactivation for hERG 1a/1b compared with hERG 1a channels. Tail currents were evoked by a step to -105 mV following a 4-sec, 60 mV pulse. D, plot quantifying data showing recovery from inactivation is faster in hERG 1a/1b compared with hERG 1a channels. Time constants were measured as the single exponential fit to the rising phase (> -80 mV) or as the fast time constant of a double exponential fit (≤ -80 mV) to the tail current. Each point is the mean ± s.e.m of seven to eight cells (P < 0.05, Mann Whitney test). Temperature was 34 ± 2°C. E, steady-state inactivation plot showing shift of V1/2 between hERG 1a and 1a/1b currents. Currents were measured at +40 mV following a series of 2-ms steps to a range of voltages from a holding potential of +40 mV.
Fig 5
Fig 5
E-4031 block of hERG1a/1b and 1a channels assessed with conventional step protocol at room temperature. Currents were recorded before drug application by stepping from -80 to +20 mV for 4 s and then to -50 mV for 5 s with 15 s interpulse interval. Channels were held closed at -80 mV for 10 min in the presence of E-4031 and then subjected to 20 voltage pulses in the continued presence of the drug. A, steady-state dose-response curves for hERG 1a and 1a/1b channels. The IC50 values for E-4031 drug block for hERG 1a and hERG 1a/1b channels were 6.2 ± 1.1 nM and 25.6 ± 4.3 nM, respectively. B, peak tail current amplitudes plotted as a function of number of pulses and fit to an exponential function to measure the time course of block. Development of E-4031 block is slower for hERG1a/b channels.
Fig 6
Fig 6
Schematic diagrams for hERG 1a/1b and hERG 1a models. In the absence of E-4031, the model for hERG 1a/1b (blue) operates in normal mode, while the hERG 1a model (red) operates in both normal mode and N-mode (turquoise rectangle). Transition rates for the N-mode are different from those for the normal mode as described in the upper right corner of the figure. Normal mode transition rates are identical for hERG 1a/1b and 1a models. Open states, circled in black, are all equally conducting. The presence of E-4031 allows entry into the E-4031-block mode (green rectangles for both hERG 1a/1b and 1a). E-4031-block mode and N-mode may coincide for hERG 1a (intersection of turquoise and green rectangles).
Fig 7
Fig 7
Voltage-dependent behavior. Left column shows experimental results and right column shows corresponding simulation results. hERG 1a/1b is in blue and hERG 1a is in red. A, Step current. Plot shows relative current at the end of 4 seconds at the indicated potentials from a -80 mV holding potential divided by the extrapolated peak tail current at -105 mV. Results are normalized to the maximum for hERG 1a/1b. B, Steady-state activation. Plot shows normalized maximal tail currents at steps to -105 mV following a 4 second step to the indicated potentials from a -80 mV holding potential. For computation of steady state activation, movement from state i to state c1 was not allowed in order to prevent artifactual recovery to c1 instead of o at the most depolarized potentials. C, Time constant for inactivation. We fit decay of the currents elicited by steps to the indicated potentials following a 500 ms step to 60 mV then a 2 ms step to -100 mV from a -80 mV holding potential. D, Time constant for recovery from inactivation. We fit decay of currents elicited by steps to the indicated potentials following a 500 ms step to 60 mV from a -80 mV holding potential.
Fig 8
Fig 8
Action potential voltage clamp and E-4031 drug sensitivity. hERG 1a/1b is in blue and hERG 1a is in red. For panels A and C, the left column shows experimental results and the right column shows corresponding simulation results. A, Action potential voltage clamp. Shown are current responses (scale to the left of panel) to the voltage-clamp waveform (black, scale to the right of panel). Results are normalized to the maximum for hERG 1a/1b. The difference in time at which maximum current occurs for hERG 1a/1b versus hERG 1a is reproduced by the simulations (experiment: Δt = 49 ms; simulation: Δt = 54 ms). B, Experiments show that hERG 1a/1b contributes significantly more charge during the action potential than hERG 1a (p<0.05, Mann Whitney test, n=5, s.e.m. error bars). Relative charge is measured by integrating the current and dividing by the value obtained for hERG 1a/1b. Simulations (gray) agree with experiments (black). C, Dose-response curve for E-4031. Tail currents were elicited by 5 second steps to -50 mV following 4 seconds at 20 mV from a 15 second -80 mV holding step. We plot tail currents at the 20th cycle of this protocol divided by that for the 1st cycle for various E-4031 doses.
Fig 9
Fig 9
Effect of E-4031 on the action potential. The left column shows action potentials from the Fink modified ten Tusscher action potential model in which hERG 1a/1b (blue) and hERG 1a (red) were substituted for the native IKr. As [E-4031] increases (0, 5, and 10 nM for panels A, B, and C respectively), APD90 increases, and IhERG decreases for both hERG 1a/1b and 1a. ΔAPD90 (the difference in APD90 between hERG 1a/1b and hERG 1a) also increases with [E-4031] ([E-4031] = 0 nM, ΔAPD90 = 38 ms; [E-4031] = 5 nM, ΔAPD90 = 168 ms; [E-4031] = 10 nM, ΔAPD90 = 728 ms). In all cases, APD90 is longer and peak IhERG is smaller for hERG 1a. For control and for [E-4031] = 5 nM, peak IhERG occurs later for hERG 1a. For hERG 1a at [E-4031] = 10 nM (bottom row, red), repolarization fails to occur within the 1 sec cycle length on odd numbered beats. To mark the takeoff potential of the odd beat for hERG 1a, we place a red arrow. The alternating pattern for hERG 1a is a consequence of sustained depolarization curtailing deactivation at the end of even beats.
Fig 10
Fig 10
Molecular characterization of mutation hERG 1b 23C>T encoding A8V in patient DNA. A, Schematic of hERG 1b N-terminal sequence encompassing A8V mutation. B, Denaturing high performance liquid chromatography (DHPLC) chromatogram revealing a wild-type (blue peak) and an abnormal elution profile (red peak). C, Corresponding DNA sequencing chromatograms revealing the heterozygote 23C>T missense mutation encoding A8V identified in HERG exon 1b.
Fig 11
Fig 11
Loss of hERG 1b protein attributed to A8V mutation in HEK-293 cells. A, Western blot analysis of HEK-293 cell lysates probed with a C-terminal pan-hERG antibody (α-CT). Protein disulfide isomerase (PDI), an ER-resident protein, was used as a loading control (α-PDI). Lane 1, hERG 1b. Lane 2, hERG 1a. Lane 3, hERG 1b + hERG 1a. Lane 4, mutant hERG 1bA8V. Lane 5, hERG 1a. Lane 6, mutant hERG 1bA8V + hERG 1a. Lane 7, hERG 1b. B, Current traces from hERG 1a stably expressed in HEK-293 cells recorded at room temperature, evoked from a holding potential of -80 mV and stepped from -100 to +60 mV, followed by a step to -105 mV. C, Currents as in B but from stable 1a cells transiently transfected with hERG 1b. D, Currents as in B but from stable 1a cells transiently transfected with A8V-1b. Capacitive transient upon repolarization is deleted in D to make small tail current more visible.

Similar articles

Cited by

References

    1. Sanguinetti MC, Jurkiewicz NK. Delayed rectifier outward K+ current is composed of two currents in guinea pig atrial cells. Am J Physiol. 1991;260:H393–399. - PubMed
    1. Shibasaki T. Conductance and kinetics of delayed rectifier potassium channels in nodal cells of the rabbit heart. J Physiol (Lond) 1987;387:227–250. - PMC - PubMed
    1. Sanguinetti MC, Jiang C, Curran ME, Keating MT. A mechanistic link between an inherited and an acquired cardiac arrhythmia: HERG encodes the IKr potassium channel. Cell. 1995;81:299–307. - PubMed
    1. Trudeau MC, Warmke JW, Ganetzky B, Robertson GA. HERG, a human inward rectifier in the voltage-gated potassium channel family. Science. 1995;269:92–95. - PubMed
    1. Curran ME, Splawski I, Timothy KW, Vincent GM, Green ED, Keating MT. A molecular basis for cardiac arrhythmia: HERG mutations cause long QT syndrome. Cell. 1995;80:795–803. - PubMed

Publication types

MeSH terms