Comparative Study
. 2008 Sep 16;105(37):14112-7.
doi: 10.1073/pnas.0806158105. Epub 2008 Sep 5.

Comparisons of tyrosine phosphorylated proteins in cells expressing lung cancer-specific alleles of EGFR and KRAS

Affiliations
Comparative Study

Comparisons of tyrosine phosphorylated proteins in cells expressing lung cancer-specific alleles of EGFR and KRAS

Udayan Guha et al. Proc Natl Acad Sci U S A. .

Abstract

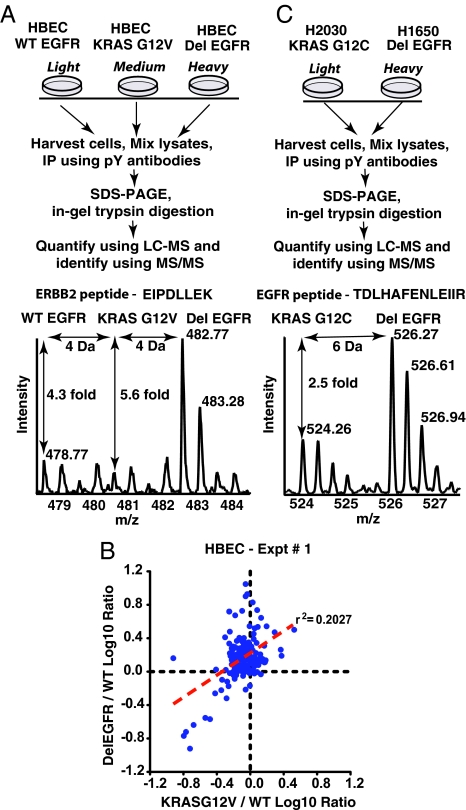
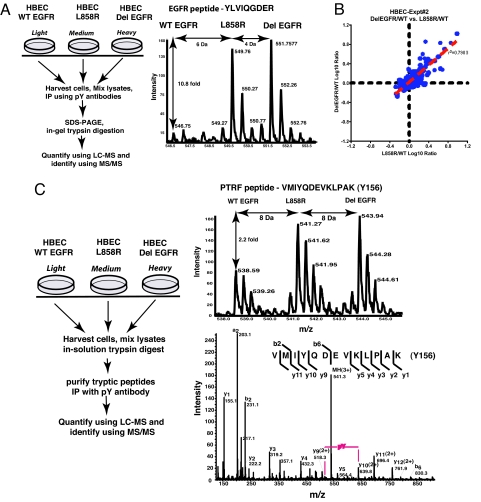
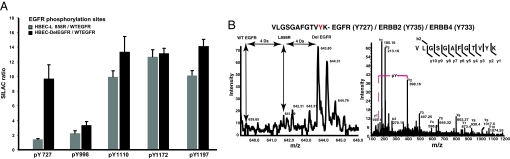
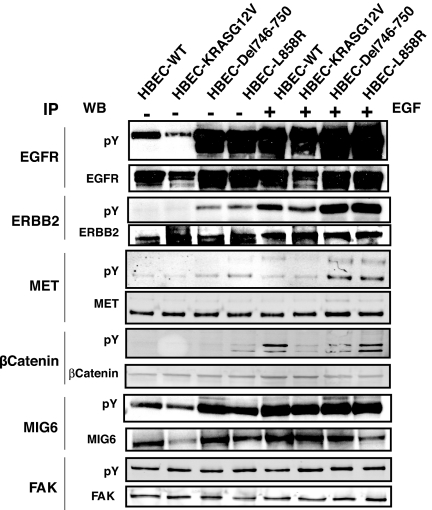
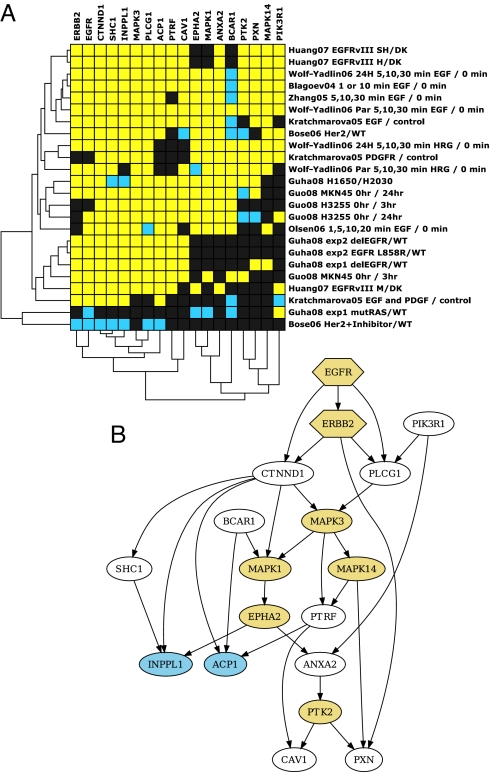
We have used unbiased phosphoproteomic approaches, based on quantitative mass spectrometry using stable isotope labeling with amino acids in cell culture (SILAC), to identify tyrosine phosphorylated proteins in isogenic human bronchial epithelial cells (HBECs) and human lung adenocarcinoma cell lines, expressing either of the two mutant alleles of EGFR (L858R and Del E746-A750), or a mutant KRAS allele, which are common in human lung adenocarcinomas. Tyrosine phosphorylation of signaling molecules was greater in HBECs expressing the mutant EGFRs than in cells expressing WT EGFR or mutant KRAS. Receptor tyrosine kinases (such as EGFR, ERBB2, MET, and IGF1R), and Mig-6, an inhibitor of EGFR signaling, were more phosphorylated in HBECs expressing mutant EGFR than in cells expressing WT EGFR or mutant RAS. Phosphorylation of some proteins differed in the two EGFR mutant-expressing cells; for example, some cell junction proteins (beta-catenin, plakoglobin, and E-cadherin) were more phosphorylated in HBECs expressing L858R EGFR than in cells expressing Del EGFR. There were also differences in degree of phosphorylation at individual tyrosine sites within a protein; for example, a previously uncharacterized phosphorylation site in the nucleotide-binding loop of the kinase domains of EGFR (Y727), ERBB2 (Y735), or ERBB4 (Y733), is phosphorylated significantly more in HBECs expressing the deletion mutant than in cells expressing the wild type or L858R EGFR. Signaling molecules not previously implicated in ERBB signaling, such as polymerase transcript release factor (PTRF), were also phosphorylated in cells expressing mutant EGFR. Bayesian network analysis of these and other datasets revealed that PTRF might be a potentially important component of the ERBB signaling network.


Conflict of interest statement

The authors declare no conflict of interest.

Figures

Fig. 1.
Fig. 1.
Increased tyrosine phosphorylation of proteins in HBECs or adenocarcinoma cells expressing mutant EGFR compared with cells expressing mutant KRAS. Schematic of experimental design and representative MS spectra of a peptide of ERBB2 (A) and a peptide of EGFR (C) identified in the phosphotyrosine immunoprecipitates of proteins from lysates of HBECs and adenocarcinoma cell lines, respectively. (B) The degree of tyrosine phosphorylation of proteins in mutant RAS expressing cells does not correlate with that in mutant EGFR-expressing cells as demonstrated in the log-log plot of the two ratios obtained in this experiment (Del EGFR/WT EGFR and Mut RAS/WT EGFR). Log 10 transformation of SILAC ratios for individual proteins and linear regression analysis yields a coefficient of determination (r2) of 0.20, and a Pearson product-moment correlation (r) of 0.45.
Fig. 2.
Fig. 2.
Extent of tyrosine phosphorylation is similar between HBECs expressing L858R EGFR or Del EGFR. (A) Experimental design and a representative MS spectrum of EGFR shows the increased abundance of this peptide in phosphotyrosine immunoprecipitates of proteins from the EGFR mutant-expressing cell lines compared with HBECs expressing WT EGFR. (B) The degree of tyrosine phosphorylation of proteins is similar in the HBECs expressing the two EGFR mutants as shown by the log-log plot of the two ratios obtained in this experiment (Del EGFR/WT EGFR and L858R/WT EGFR). Log 10 transformation of SILAC ratios for individual proteins and linear regression analysis yields a coefficient of determination (r2) of 0.79, and a Pearson product-moment correlation coefficient (r) of 0.89. (C) Schematic of the experimental design (left panel) to compare the extent of site-specific phosphorylation. The MS spectrum of the peptide VMIYQDEVKLPAK of PTRF in the right upper panel shows that the abundance of this peptide is higher in each of the two mutant EGFR-expressing cell lines compared with HBECs expressing WT EGFR. The MS/MS spectrum of the same peptide in right lower panel shows that Y156 of PTRF is phosphorylated. Because tyrosine phosphorylated peptides have specifically been enriched in this experiment, it can be inferred that the phosphorylation is more in the EGFR mutant-expressing lines.
Fig. 3.
Fig. 3.
Differential extent of phosphorylation at individual tyrosine sites in EGFR between the two mutant EGFR-expressing HBECs and cells expressing WT EGFR. (A) Ratio of abundance of peptides containing each of the indicated phosphorylated tyrosine residues in L858R or Del EGFR compared with WT EGFR. Note that the tryptic peptide containing Y727 of EGFR is also present in ERBB2 (Y735) and ERBB4 (Y733). Mean and STDV are shown from three independent peptide-level phosphotyrosine IPs and three separate mass spectrometry analyses. (B) MS and MS/MS spectra of the tryptic peptide containing Y727 of EGFR show that Y727 is phosphorylated in Del-EGFR but not in WT EGFR and minimally in L858R EGFR. The locations of possible peaks of this peptide from WTEGFR and L858R are shown in the MS spectrum.
Fig. 4.
Fig. 4.
Validation of mass spectrometry-based quantitation by immunoprecipitation and Western blots of representative proteins. Immunoprecipitation was done with antibodies to the indicated proteins from lysates of HBECs, and Western blots done with anti-phosphotyrosine and protein-specific antibodies.
Fig. 5.
Fig. 5.
Bayesian network modeling of phosphorylation data from the current study and eight other published ERBB signaling related tyrosine phosphorylation data. (A) The heatmap of the 18 proteins with the approximations for the missing data generated by the “nearest neighbor method” using a discrete distance measure. (B) The top scoring Bayesian network generated from the above phosphorylation data. The nodes are obtained from the phosphorylation ratios from the datasets. The edges represent direct and indirect causal influence. The arrows indicate the direction of causality. Nodes connected by black edges have the same phosphorylation level more often than not, indicating a positive influence. EGFR and ERBB2, were forced source nodes in the network; they were only allowed outgoing edges except between each other. Nodes were restricted to have no more than three parents. Yellow nodes are kinases and blue nodes phosphatases.

References

    1. Lynch TJ, et al. Activating mutations in the epidermal growth factor receptor underlying responsiveness of non-small-cell lung cancer to gefitinib. N Engl J Med. 2004;350:2129–2139. - PubMed
    1. Paez JG, et al. EGFR mutations in lung cancer: correlation with clinical response to gefitinib therapy. Science. 2004;304:1497–1500. - PubMed
    1. Pao W, et al. EGF receptor gene mutations are common in lung cancers from “never smokers” and are associated with sensitivity of tumors to gefitinib and erlotinib. Proc Natl Acad Sci USA. 2004;101:13306–13311. - PMC - PubMed
    1. Shigematsu H, et al. Clinical and biological features associated with epidermal growth factor receptor gene mutations in lung cancers. J Natl Cancer Inst. 2005;97:339–346. - PubMed
    1. Pao W, et al. KRAS mutations and primary resistance of lung adenocarcinomas to gefitinib or erlotinib. PLoS Med. 2005;2:e17. - PMC - PubMed

Publication types

MeSH terms